RouteMobile ROUTE full analysis,charts,indicators,moving averages,SMA,DMA,EMA,ADX,MACD,RSIRoute Mobile ROUTE WideScreen charts, DMA,SMA,EMA technical analysis, forecast prediction, by indicators ADX,MACD,RSI,CCI NSE stock exchange
Daily price and charts and targets RouteMobile Strong Daily Stock price targets for RouteMobile ROUTE are 721.35 and 731.35 | Daily Target 1 | 719.23 | | Daily Target 2 | 723.47 | | Daily Target 3 | 729.23333333333 | | Daily Target 4 | 733.47 | | Daily Target 5 | 739.23 |
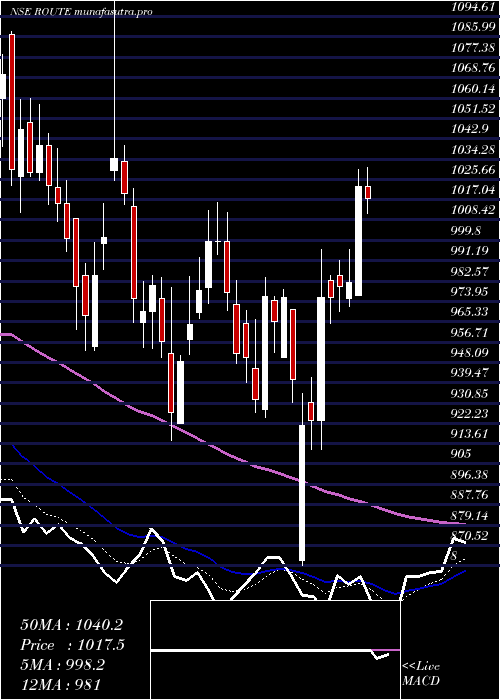
Daily price and volume Route Mobile
| Date |
Closing |
Open |
Range |
Volume |
Tue 28 October 2025 |
727.70 (-0.53%) |
734.00 |
725.00 - 735.00 |
0.8677 times |
Mon 27 October 2025 |
731.60 (1.01%) |
728.00 |
720.25 - 733.75 |
0.9693 times |
Fri 24 October 2025 |
724.25 (-0.63%) |
731.55 |
722.80 - 731.60 |
0.8046 times |
Thu 23 October 2025 |
728.85 (-1.17%) |
741.00 |
726.05 - 741.05 |
1.1522 times |
Tue 21 October 2025 |
737.50 (2.03%) |
740.00 |
730.10 - 741.00 |
0.4416 times |
Mon 20 October 2025 |
722.85 (-1.23%) |
731.85 |
714.20 - 733.20 |
1.6061 times |
Fri 17 October 2025 |
731.85 (-0.26%) |
741.10 |
730.20 - 741.10 |
0.9068 times |
Thu 16 October 2025 |
733.75 (-0.25%) |
737.00 |
731.90 - 744.60 |
1.3364 times |
Wed 15 October 2025 |
735.60 (-0.93%) |
745.90 |
728.55 - 746.25 |
1.0265 times |
Tue 14 October 2025 |
742.50 (-1.56%) |
754.60 |
739.40 - 758.80 |
0.8887 times |
Mon 13 October 2025 |
754.30 (-0.82%) |
764.95 |
753.05 - 764.95 |
0.7081 times |
Weekly price and charts RouteMobile Strong weekly Stock price targets for RouteMobile ROUTE are 716.6 and 731.35 | Weekly Target 1 | 712.9 | | Weekly Target 2 | 720.3 | | Weekly Target 3 | 727.65 | | Weekly Target 4 | 735.05 | | Weekly Target 5 | 742.4 |
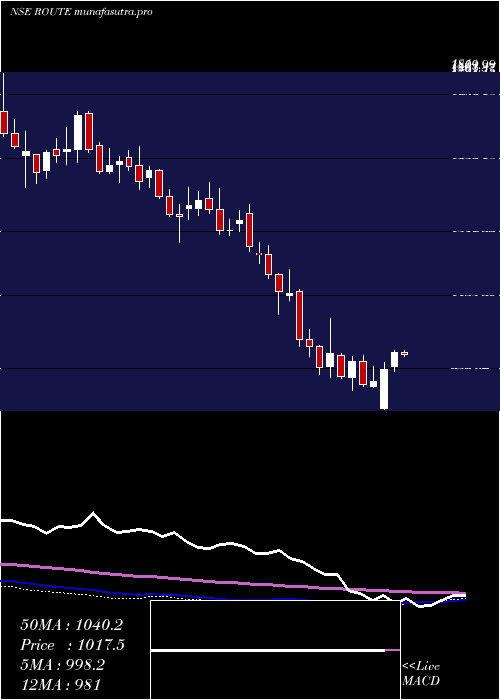
Weekly price and volumes for Route Mobile
| Date |
Closing |
Open |
Range |
Volume |
Tue 28 October 2025 |
727.70 (0.48%) |
728.00 |
720.25 - 735.00 |
0.4829 times |
Fri 24 October 2025 |
724.25 (-1.04%) |
731.85 |
714.20 - 741.05 |
1.0527 times |
Fri 17 October 2025 |
731.85 (-3.77%) |
764.95 |
728.55 - 764.95 |
1.2793 times |
Fri 10 October 2025 |
760.55 (-4.29%) |
797.40 |
758.20 - 799.20 |
1.351 times |
Fri 03 October 2025 |
794.60 (-0.61%) |
810.00 |
780.20 - 819.75 |
1.1146 times |
Fri 26 September 2025 |
799.50 (-6.56%) |
855.75 |
789.30 - 857.75 |
1.1868 times |
Fri 19 September 2025 |
855.60 (-1.85%) |
873.00 |
851.70 - 890.00 |
0.9589 times |
Fri 12 September 2025 |
871.70 (1.24%) |
868.00 |
852.05 - 890.40 |
0.9739 times |
Fri 05 September 2025 |
861.05 (1.54%) |
847.00 |
841.25 - 878.10 |
1.0632 times |
Fri 29 August 2025 |
847.95 (-3.67%) |
883.30 |
847.00 - 885.00 |
0.5367 times |
Fri 22 August 2025 |
880.30 (1.01%) |
874.00 |
867.40 - 921.60 |
0.61 times |
Monthly price and charts RouteMobile Strong monthly Stock price targets for RouteMobile ROUTE are 670.55 and 771.35 | Monthly Target 1 | 651.5 | | Monthly Target 2 | 689.6 | | Monthly Target 3 | 752.3 | | Monthly Target 4 | 790.4 | | Monthly Target 5 | 853.1 |
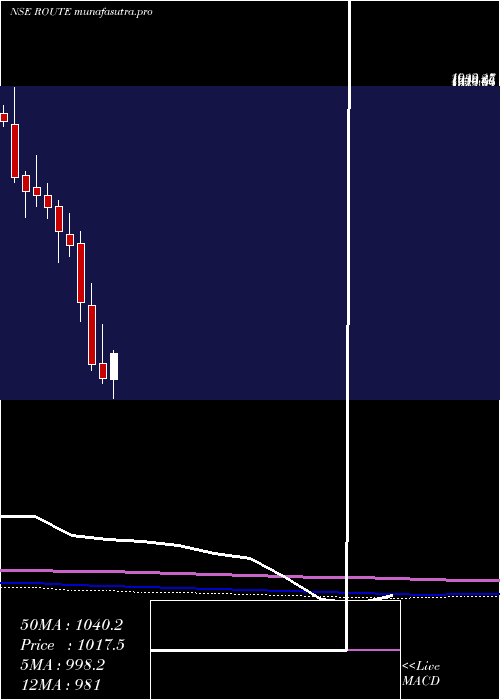
Monthly price and volumes Route Mobile
| Date |
Closing |
Open |
Range |
Volume |
Tue 28 October 2025 |
727.70 (-8.07%) |
788.00 |
714.20 - 815.00 |
0.6144 times |
Tue 30 September 2025 |
791.55 (-6.65%) |
847.00 |
780.20 - 890.40 |
0.6895 times |
Fri 29 August 2025 |
847.95 (-6.02%) |
906.80 |
847.00 - 921.60 |
0.3353 times |
Thu 31 July 2025 |
902.30 (-11.86%) |
1024.10 |
894.60 - 1034.50 |
0.6386 times |
Mon 30 June 2025 |
1023.75 (7.85%) |
955.00 |
945.15 - 1158.00 |
3.9007 times |
Fri 30 May 2025 |
949.25 (-0.18%) |
951.95 |
900.00 - 1004.00 |
0.6214 times |
Wed 30 April 2025 |
950.95 (2.01%) |
928.00 |
861.90 - 1040.00 |
0.6835 times |
Fri 28 March 2025 |
932.20 (-4.89%) |
984.95 |
914.95 - 1120.00 |
1.5989 times |
Fri 28 February 2025 |
980.10 (-18.12%) |
1186.05 |
961.90 - 1260.00 |
0.4814 times |
Fri 31 January 2025 |
1197.00 (-14.06%) |
1399.00 |
1131.10 - 1442.00 |
0.4362 times |
Tue 31 December 2024 |
1392.85 (-3.31%) |
1431.00 |
1355.00 - 1505.20 |
0.5238 times |
DMA SMA EMA moving averages of Route Mobile ROUTE
DMA (daily moving average) of Route Mobile ROUTE
| DMA period | DMA value | | 5 day DMA | 729.98 | | 12 day DMA | 735.94 | | 20 day DMA | 754.69 | | 35 day DMA | 797.17 | | 50 day DMA | 819.11 | | 100 day DMA | 895.16 | | 150 day DMA | 918.8 | | 200 day DMA | 972.99 | EMA (exponential moving average) of Route Mobile ROUTE
| EMA period | EMA current | EMA prev | EMA prev2 | | 5 day EMA | 729.72 | 730.73 | 730.3 | | 12 day EMA | 740.51 | 742.84 | 744.88 | | 20 day EMA | 757.16 | 760.26 | 763.28 | | 35 day EMA | 784.11 | 787.43 | 790.72 | | 50 day EMA | 814.44 | 817.98 | 821.5 |
SMA (simple moving average) of Route Mobile ROUTE
| SMA period | SMA current | SMA prev | SMA prev2 | | 5 day SMA | 729.98 | 729.01 | 729.06 | | 12 day SMA | 735.94 | 738.76 | 742.11 | | 20 day SMA | 754.69 | 758.28 | 763.17 | | 35 day SMA | 797.17 | 800.98 | 804.53 | | 50 day SMA | 819.11 | 822.24 | 824.86 | | 100 day SMA | 895.16 | 897.38 | 899.61 | | 150 day SMA | 918.8 | 920.37 | 921.82 | | 200 day SMA | 972.99 | 976.11 | 979.43 |
|
|
