RossellTechsys ROSSTECH full analysis,charts,indicators,moving averages,SMA,DMA,EMA,ADX,MACD,RSIRossell Techsys ROSSTECH WideScreen charts, DMA,SMA,EMA technical analysis, forecast prediction, by indicators ADX,MACD,RSI,CCI NSE stock exchange
Daily price and charts and targets RossellTechsys Strong Daily Stock price targets for RossellTechsys ROSSTECH are 620.98 and 674.48 | Daily Target 1 | 610.32 | | Daily Target 2 | 631.63 | | Daily Target 3 | 663.81666666667 | | Daily Target 4 | 685.13 | | Daily Target 5 | 717.32 |
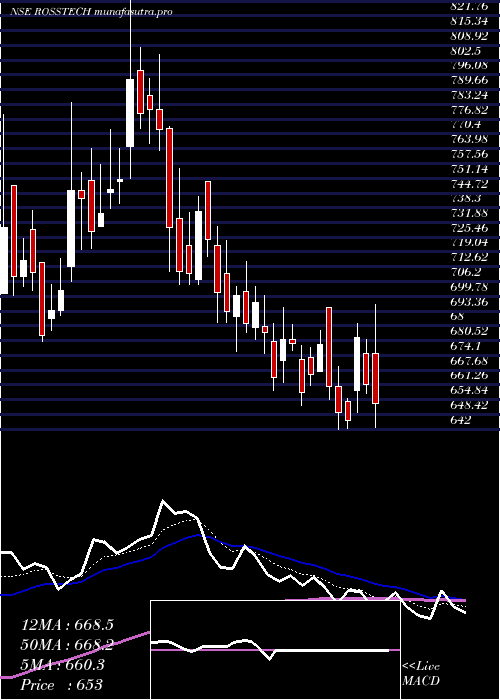
Daily price and volume Rossell Techsys
| Date |
Closing |
Open |
Range |
Volume |
Thu 30 October 2025 |
652.95 (-1.28%) |
675.00 |
642.50 - 696.00 |
2.4628 times |
Wed 29 October 2025 |
661.40 (-2.98%) |
675.00 |
657.30 - 680.85 |
0.679 times |
Tue 28 October 2025 |
681.70 (5.56%) |
659.00 |
649.25 - 688.00 |
1.8462 times |
Mon 27 October 2025 |
645.80 (-0.5%) |
653.95 |
642.15 - 655.45 |
0.5897 times |
Fri 24 October 2025 |
649.05 (-1.72%) |
660.40 |
642.00 - 669.15 |
1.3692 times |
Thu 23 October 2025 |
660.40 (-2.75%) |
695.00 |
654.90 - 695.00 |
0.5151 times |
Tue 21 October 2025 |
679.05 (1.97%) |
667.00 |
667.00 - 685.00 |
0.1744 times |
Mon 20 October 2025 |
665.90 (1.21%) |
673.00 |
661.10 - 677.30 |
0.7764 times |
Fri 17 October 2025 |
657.95 (-3.14%) |
672.50 |
652.10 - 678.50 |
0.983 times |
Thu 16 October 2025 |
679.30 (-0.24%) |
681.00 |
676.30 - 687.65 |
0.6043 times |
Wed 15 October 2025 |
680.95 (2.49%) |
671.90 |
662.20 - 695.00 |
0.9365 times |
Weekly price and charts RossellTechsys Strong weekly Stock price targets for RossellTechsys ROSSTECH are 620.63 and 674.48 | Weekly Target 1 | 609.85 | | Weekly Target 2 | 631.4 | | Weekly Target 3 | 663.7 | | Weekly Target 4 | 685.25 | | Weekly Target 5 | 717.55 |
Weekly price and volumes for Rossell Techsys
| Date |
Closing |
Open |
Range |
Volume |
Thu 30 October 2025 |
652.95 (0.6%) |
653.95 |
642.15 - 696.00 |
0.4576 times |
Fri 24 October 2025 |
649.05 (-1.35%) |
673.00 |
642.00 - 695.00 |
0.2326 times |
Fri 17 October 2025 |
657.95 (-5.62%) |
686.60 |
652.10 - 700.00 |
0.3914 times |
Fri 10 October 2025 |
697.10 (-3.76%) |
722.10 |
675.55 - 729.90 |
0.7308 times |
Fri 03 October 2025 |
724.30 (-0.72%) |
733.80 |
704.85 - 755.35 |
0.5623 times |
Fri 26 September 2025 |
729.55 (-2.78%) |
765.00 |
710.55 - 832.00 |
2.1905 times |
Fri 19 September 2025 |
750.45 (0.61%) |
745.95 |
720.05 - 772.50 |
0.9082 times |
Fri 12 September 2025 |
745.90 (4.3%) |
729.00 |
680.00 - 784.00 |
1.675 times |
Fri 05 September 2025 |
715.15 (6.44%) |
685.00 |
682.00 - 778.90 |
2.2442 times |
Fri 29 August 2025 |
671.85 (-1.5%) |
692.35 |
639.45 - 697.95 |
0.6073 times |
Fri 22 August 2025 |
682.10 (11.68%) |
620.00 |
620.00 - 735.00 |
3.9604 times |

Monthly price and charts RossellTechsys Strong monthly Stock price targets for RossellTechsys ROSSTECH are 593.53 and 701.43 | Monthly Target 1 | 573.72 | | Monthly Target 2 | 613.33 | | Monthly Target 3 | 681.61666666667 | | Monthly Target 4 | 721.23 | | Monthly Target 5 | 789.52 |
Monthly price and volumes Rossell Techsys
| Date |
Closing |
Open |
Range |
Volume |
Thu 30 October 2025 |
652.95 (-8%) |
707.00 |
642.00 - 749.90 |
0.7341 times |
Tue 30 September 2025 |
709.70 (5.63%) |
685.00 |
680.00 - 832.00 |
2.6522 times |
Fri 29 August 2025 |
671.85 (18.79%) |
553.10 |
549.05 - 735.00 |
2.7718 times |
Thu 31 July 2025 |
565.60 (100.5%) |
509.00 |
456.10 - 619.40 |
1.1493 times |
Wed 05 March 2025 |
282.10 (5.08%) |
272.25 |
245.15 - 293.80 |
0.0468 times |
Fri 28 February 2025 |
268.45 (-32.14%) |
396.00 |
260.10 - 419.00 |
0.3456 times |
Fri 31 January 2025 |
395.60 (-13.78%) |
463.10 |
377.30 - 498.80 |
0.2292 times |
Tue 31 December 2024 |
458.85 (0%) |
500.00 |
434.95 - 514.00 |
0.071 times |
Thu 30 October 2025 |
(0%) |
|
- |
0 times |

DMA SMA EMA moving averages of Rossell Techsys ROSSTECH
DMA (daily moving average) of Rossell Techsys ROSSTECH
| DMA period | DMA value | | 5 day DMA | 658.18 | | 12 day DMA | 664.9 | | 20 day DMA | 680.17 | | 35 day DMA | 706.42 | | 50 day DMA | 700.95 | | 100 day DMA | 572.47 | | 150 day DMA | | | 200 day DMA | | EMA (exponential moving average) of Rossell Techsys ROSSTECH
| EMA period | EMA current | EMA prev | EMA prev2 | | 5 day EMA | 660.28 | 663.95 | 665.23 | | 12 day EMA | 668.49 | 671.31 | 673.11 | | 20 day EMA | 677.94 | 680.57 | 682.59 | | 35 day EMA | 682.88 | 684.64 | 686.01 | | 50 day EMA | 690.41 | 691.94 | 693.19 |
SMA (simple moving average) of Rossell Techsys ROSSTECH
| SMA period | SMA current | SMA prev | SMA prev2 | | 5 day SMA | 658.18 | 659.67 | 663.2 | | 12 day SMA | 664.9 | 667.48 | 670.46 | | 20 day SMA | 680.17 | 683 | 685.47 | | 35 day SMA | 706.42 | 707.28 | 708.68 | | 50 day SMA | 700.95 | 702.15 | 701.13 | | 100 day SMA | 572.47 | 570.03 | 567.44 | | 150 day SMA | | 200 day SMA |
|
|
