RossellIndia ROSSELLIND_BE full analysis,charts,indicators,moving averages,SMA,DMA,EMA,ADX,MACD,RSIRossell India ROSSELLIND_BE WideScreen charts, DMA,SMA,EMA technical analysis, forecast prediction, by indicators ADX,MACD,RSI,CCI NSE stock exchange
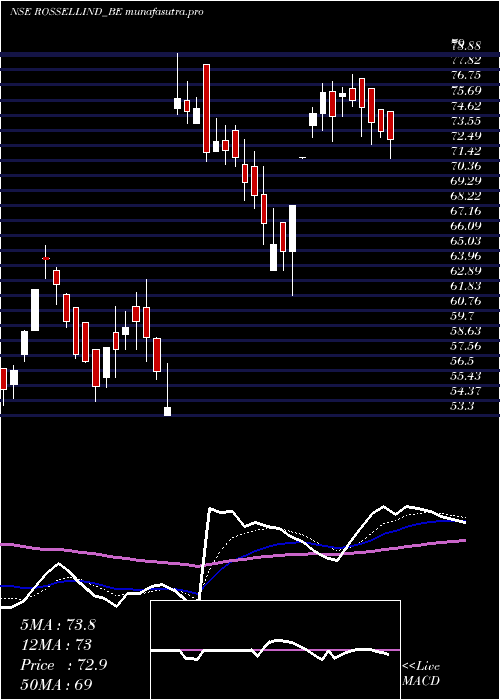
Daily price and charts and targets RossellIndia Strong Daily Stock price targets for RossellIndia ROSSELLIND_BE are 70.58 and 73.88 | Daily Target 1 | 69.8 | | Daily Target 2 | 71.36 | | Daily Target 3 | 73.103333333333 | | Daily Target 4 | 74.66 | | Daily Target 5 | 76.4 |
Daily price and volume Rossell India
| Date |
Closing |
Open |
Range |
Volume |
Fri 23 May 2025 |
72.91 (-0.76%) |
74.85 |
71.55 - 74.85 |
0.744 times |
Thu 22 May 2025 |
73.47 (-0.84%) |
75.00 |
73.00 - 75.00 |
0.3373 times |
Wed 21 May 2025 |
74.09 (-1.42%) |
76.50 |
72.50 - 76.50 |
0.7225 times |
Tue 20 May 2025 |
75.16 (-0.65%) |
77.20 |
73.10 - 77.20 |
0.838 times |
Mon 19 May 2025 |
75.65 (-0.62%) |
76.49 |
75.20 - 77.50 |
0.9422 times |
Fri 16 May 2025 |
76.12 (2.16%) |
75.90 |
74.55 - 76.59 |
0.9385 times |
Thu 15 May 2025 |
74.51 (-2.23%) |
76.31 |
72.72 - 77.00 |
1.5392 times |
Wed 14 May 2025 |
76.21 (1.97%) |
74.74 |
73.50 - 76.89 |
0.9477 times |
Tue 13 May 2025 |
74.74 (4.43%) |
73.85 |
73.05 - 75.14 |
2.4721 times |
Mon 12 May 2025 |
71.57 (4.99%) |
71.57 |
71.50 - 71.57 |
0.5184 times |
Fri 09 May 2025 |
68.17 (4.99%) |
64.93 |
61.80 - 68.17 |
1.3818 times |
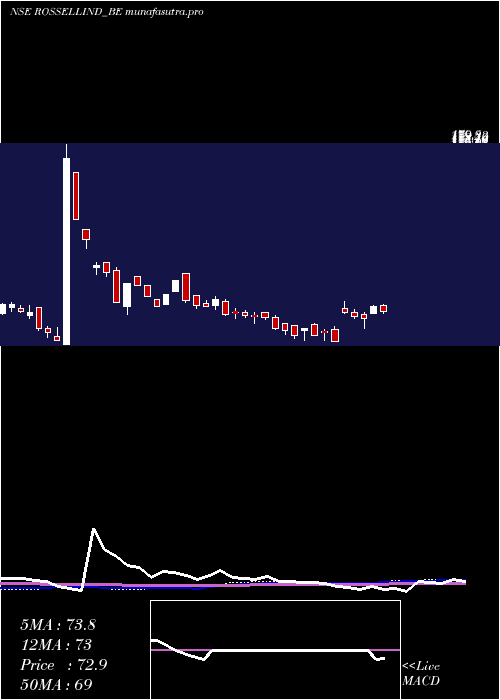
Weekly price and charts RossellIndia Strong weekly Stock price targets for RossellIndia ROSSELLIND_BE are 69.26 and 75.21 | Weekly Target 1 | 68.04 | | Weekly Target 2 | 70.47 | | Weekly Target 3 | 73.986666666667 | | Weekly Target 4 | 76.42 | | Weekly Target 5 | 79.94 |
Weekly price and volumes for Rossell India
| Date |
Closing |
Open |
Range |
Volume |
Fri 23 May 2025 |
72.91 (-4.22%) |
76.49 |
71.55 - 77.50 |
0.6384 times |
Fri 16 May 2025 |
76.12 (11.66%) |
71.57 |
71.50 - 77.00 |
1.1428 times |
Fri 09 May 2025 |
68.17 (-2.38%) |
71.00 |
61.80 - 72.00 |
0.8201 times |
Fri 02 May 2025 |
69.83 (-2.95%) |
72.00 |
68.55 - 74.39 |
0.5267 times |
Fri 25 April 2025 |
71.95 (33.59%) |
75.10 |
71.32 - 79.00 |
0.8549 times |
Fri 28 March 2025 |
53.86 (-9.52%) |
61.02 |
53.30 - 62.91 |
1.3148 times |
Fri 21 March 2025 |
59.53 (3.39%) |
59.90 |
54.27 - 61.00 |
1.2584 times |
Thu 13 March 2025 |
57.58 (-7.49%) |
64.45 |
57.30 - 65.35 |
1.4154 times |
Fri 07 March 2025 |
62.24 (7.94%) |
60.50 |
54.00 - 62.24 |
1.658 times |
Fri 28 February 2025 |
57.66 (-5.44%) |
63.60 |
55.50 - 63.60 |
0.3706 times |
Fri 21 February 2025 |
60.98 (-1.91%) |
64.95 |
58.00 - 64.95 |
0.6544 times |
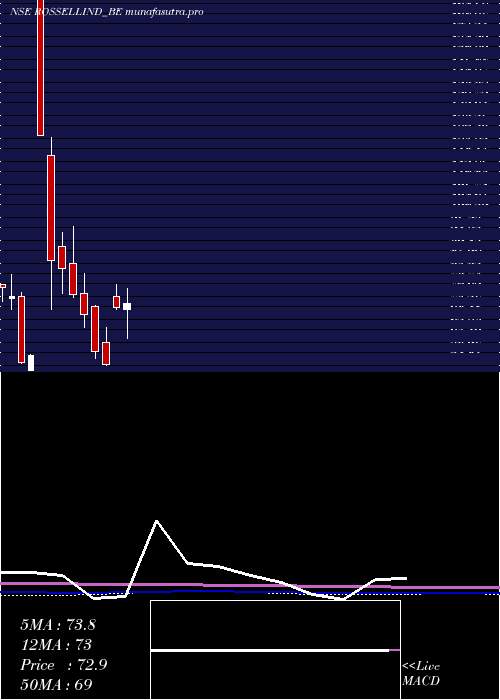
Monthly price and charts RossellIndia Strong monthly Stock price targets for RossellIndia ROSSELLIND_BE are 67.36 and 83.06 | Monthly Target 1 | 55.04 | | Monthly Target 2 | 63.97 | | Monthly Target 3 | 70.736666666667 | | Monthly Target 4 | 79.67 | | Monthly Target 5 | 86.44 |
Monthly price and volumes Rossell India
| Date |
Closing |
Open |
Range |
Volume |
Fri 23 May 2025 |
72.91 (1.79%) |
71.11 |
61.80 - 77.50 |
0.6675 times |
Wed 30 April 2025 |
71.63 (32.99%) |
75.10 |
71.00 - 79.00 |
0.3203 times |
Fri 28 March 2025 |
53.86 (-6.59%) |
60.50 |
53.30 - 65.35 |
1.4005 times |
Fri 28 February 2025 |
57.66 (-16.95%) |
71.94 |
55.50 - 72.40 |
1.3284 times |
Fri 31 January 2025 |
69.43 (-8.15%) |
75.99 |
65.23 - 82.50 |
1.0297 times |
Tue 31 December 2024 |
75.59 (-9.9%) |
85.57 |
74.70 - 97.24 |
1.5505 times |
Fri 29 November 2024 |
83.90 (-2.97%) |
90.79 |
75.99 - 95.32 |
0.5258 times |
Thu 31 October 2024 |
86.47 (-31.18%) |
119.36 |
70.98 - 125.32 |
2.7946 times |
Mon 30 September 2024 |
125.65 (122%) |
179.80 |
125.65 - 179.80 |
0.3753 times |
Tue 03 March 2020 |
56.60 (4.04%) |
51.80 |
51.80 - 56.90 |
0.0074 times |
Fri 28 February 2020 |
54.40 (-27.71%) |
75.00 |
54.15 - 76.50 |
0.1091 times |
DMA SMA EMA moving averages of Rossell India ROSSELLIND_BE
DMA (daily moving average) of Rossell India ROSSELLIND_BE
| DMA period | DMA value | | 5 day DMA | 74.26 | | 12 day DMA | 73.13 | | 20 day DMA | 71.85 | | 35 day DMA | 67.43 | | 50 day DMA | 65.01 | | 100 day DMA | 69.66 | | 150 day DMA | 78.92 | | 200 day DMA | 76.91 | EMA (exponential moving average) of Rossell India ROSSELLIND_BE
| EMA period | EMA current | EMA prev | EMA prev2 | | 5 day EMA | 73.78 | 74.22 | 74.59 | | 12 day EMA | 73.02 | 73.04 | 72.96 | | 20 day EMA | 71.5 | 71.35 | 71.13 | | 35 day EMA | 68.83 | 68.59 | 68.3 | | 50 day EMA | 65.95 | 65.67 | 65.35 |
SMA (simple moving average) of Rossell India ROSSELLIND_BE
| SMA period | SMA current | SMA prev | SMA prev2 | | 5 day SMA | 74.26 | 74.9 | 75.11 | | 12 day SMA | 73.13 | 72.51 | 71.96 | | 20 day SMA | 71.85 | 71.96 | 72.03 | | 35 day SMA | 67.43 | 67.19 | 66.87 | | 50 day SMA | 65.01 | 64.8 | 64.62 | | 100 day SMA | 69.66 | 69.84 | 70 | | 150 day SMA | 78.92 | 78.79 | 78.67 | | 200 day SMA | 76.91 | 76.93 | 76.97 |
|
|
