RM RMDRIP full analysis,charts,indicators,moving averages,SMA,DMA,EMA,ADX,MACD,RSIR M RMDRIP WideScreen charts, DMA,SMA,EMA technical analysis, forecast prediction, by indicators ADX,MACD,RSI,CCI NSE stock exchange
Daily price and charts and targets RM Strong Daily Stock price targets for RM RMDRIP are 78 and 80.97 | Daily Target 1 | 77.38 | | Daily Target 2 | 78.62 | | Daily Target 3 | 80.35 | | Daily Target 4 | 81.59 | | Daily Target 5 | 83.32 |
Daily price and volume R M
| Date |
Closing |
Open |
Range |
Volume |
Tue 28 October 2025 |
79.86 (0.03%) |
80.65 |
79.11 - 82.08 |
0.7906 times |
Mon 27 October 2025 |
79.84 (2.31%) |
79.00 |
77.36 - 80.99 |
1.073 times |
Fri 24 October 2025 |
78.04 (4.47%) |
75.80 |
74.60 - 78.79 |
1.2973 times |
Thu 23 October 2025 |
74.70 (4.67%) |
72.40 |
71.77 - 75.50 |
0.811 times |
Tue 21 October 2025 |
71.37 (2.35%) |
70.00 |
70.00 - 72.51 |
0.3415 times |
Mon 20 October 2025 |
69.73 (0.53%) |
69.89 |
69.11 - 72.21 |
0.5053 times |
Fri 17 October 2025 |
69.36 (0.12%) |
69.63 |
69.10 - 70.95 |
0.4882 times |
Thu 16 October 2025 |
69.28 (0.16%) |
69.69 |
69.10 - 71.55 |
0.439 times |
Wed 15 October 2025 |
69.17 (0.07%) |
69.10 |
69.10 - 70.54 |
3.8705 times |
Tue 14 October 2025 |
69.12 (-0.17%) |
72.00 |
69.10 - 72.00 |
0.3836 times |
Mon 13 October 2025 |
69.24 (-0.19%) |
69.37 |
69.10 - 71.00 |
1.4926 times |
Weekly price and charts RM Strong weekly Stock price targets for RM RMDRIP are 78.61 and 83.33 | Weekly Target 1 | 75.05 | | Weekly Target 2 | 77.45 | | Weekly Target 3 | 79.766666666667 | | Weekly Target 4 | 82.17 | | Weekly Target 5 | 84.49 |
Weekly price and volumes for R M
| Date |
Closing |
Open |
Range |
Volume |
Tue 28 October 2025 |
79.86 (2.33%) |
79.00 |
77.36 - 82.08 |
0.5959 times |
Fri 24 October 2025 |
78.04 (12.51%) |
69.89 |
69.11 - 78.79 |
0.9449 times |
Fri 17 October 2025 |
69.36 (-0.01%) |
69.37 |
69.10 - 72.00 |
2.1339 times |
Fri 10 October 2025 |
69.37 (-8.71%) |
74.85 |
69.10 - 76.50 |
0.8649 times |
Fri 03 October 2025 |
75.99 (-0.41%) |
75.00 |
70.00 - 78.44 |
4.4675 times |
Fri 26 September 2025 |
76.30 (-90.24%) |
789.80 |
74.45 - 807.45 |
0.5115 times |
Fri 19 September 2025 |
781.95 (1.41%) |
778.95 |
765.05 - 800.00 |
0.0882 times |
Fri 12 September 2025 |
771.05 (3.08%) |
760.05 |
735.80 - 775.00 |
0.1822 times |
Fri 05 September 2025 |
748.00 (3.26%) |
731.65 |
709.25 - 757.45 |
0.1422 times |
Fri 29 August 2025 |
724.40 (0.44%) |
733.50 |
704.10 - 750.00 |
0.0689 times |
Fri 22 August 2025 |
721.25 (4.95%) |
708.70 |
675.00 - 745.00 |
0.2608 times |

Monthly price and charts RM Strong monthly Stock price targets for RM RMDRIP are 74.48 and 87.46 | Monthly Target 1 | 64.03 | | Monthly Target 2 | 71.95 | | Monthly Target 3 | 77.013333333333 | | Monthly Target 4 | 84.93 | | Monthly Target 5 | 89.99 |
Monthly price and volumes R M
| Date |
Closing |
Open |
Range |
Volume |
Tue 28 October 2025 |
79.86 (5.29%) |
75.00 |
69.10 - 82.08 |
4.3913 times |
Tue 30 September 2025 |
75.85 (-89.53%) |
731.65 |
70.00 - 807.45 |
4.082 times |
Fri 29 August 2025 |
724.40 (6.76%) |
684.00 |
640.00 - 750.00 |
0.4215 times |
Thu 31 July 2025 |
678.50 (1269.32%) |
647.95 |
625.55 - 684.10 |
0.1499 times |
Fri 19 October 2018 |
49.55 (-19.3%) |
49.55 |
49.55 - 49.55 |
0.0011 times |
Thu 07 June 2018 |
61.40 (-9.71%) |
69.00 |
61.00 - 69.00 |
0.0227 times |
Thu 31 May 2018 |
68.00 (7.77%) |
62.00 |
62.00 - 97.40 |
0.3423 times |
Mon 30 April 2018 |
63.10 (11.68%) |
57.00 |
56.00 - 69.80 |
0.1061 times |
Wed 28 March 2018 |
56.50 (-2.59%) |
56.50 |
49.50 - 58.75 |
0.3628 times |
Wed 28 February 2018 |
58.00 (-18.31%) |
66.65 |
53.20 - 69.95 |
0.1202 times |
Wed 31 January 2018 |
71.00 (-1.66%) |
74.75 |
64.80 - 79.90 |
0.2264 times |

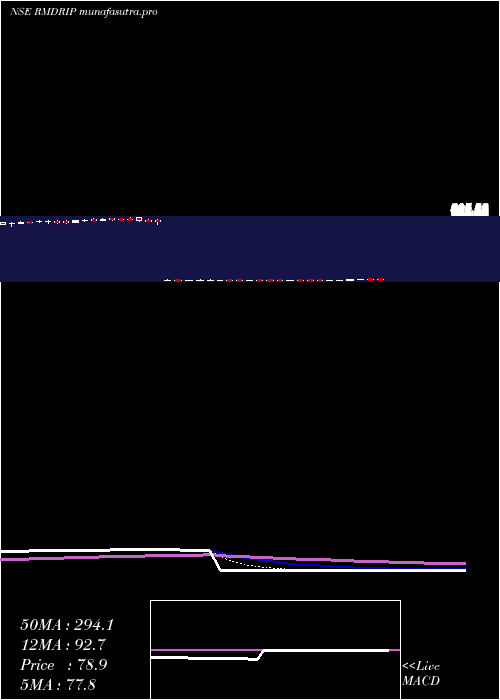
DMA SMA EMA moving averages of R M RMDRIP
DMA (daily moving average) of R M RMDRIP
| DMA period | DMA value | | 5 day DMA | 76.76 | | 12 day DMA | 72.42 | | 20 day DMA | 72.74 | | 35 day DMA | 351.83 | | 50 day DMA | 462.56 | | 100 day DMA | 332.17 | | 150 day DMA | 241 | | 200 day DMA | 199.06 | EMA (exponential moving average) of R M RMDRIP
| EMA period | EMA current | EMA prev | EMA prev2 | | 5 day EMA | 77.3 | 76.02 | 74.11 | | 12 day EMA | 95.22 | 98.01 | 101.31 | | 20 day EMA | 157.01 | 165.13 | 174.1 | | 35 day EMA | 277.12 | 288.73 | 301.03 | | 50 day EMA | 440.48 | 455.19 | 470.5 |
SMA (simple moving average) of R M RMDRIP
| SMA period | SMA current | SMA prev | SMA prev2 | | 5 day SMA | 76.76 | 74.74 | 72.64 | | 12 day SMA | 72.42 | 71.54 | 70.67 | | 20 day SMA | 72.74 | 72.56 | 106.7 | | 35 day SMA | 351.83 | 370.92 | 390 | | 50 day SMA | 462.56 | 474.4 | 485.88 | | 100 day SMA | 332.17 | 331.96 | 331.76 | | 150 day SMA | 241 | 240.94 | 240.89 | | 200 day SMA | 199.06 | 199.05 | 199.04 |
|
|
