RK RKSWAMY full analysis,charts,indicators,moving averages,SMA,DMA,EMA,ADX,MACD,RSIR K RKSWAMY WideScreen charts, DMA,SMA,EMA technical analysis, forecast prediction, by indicators ADX,MACD,RSI,CCI NSE stock exchange
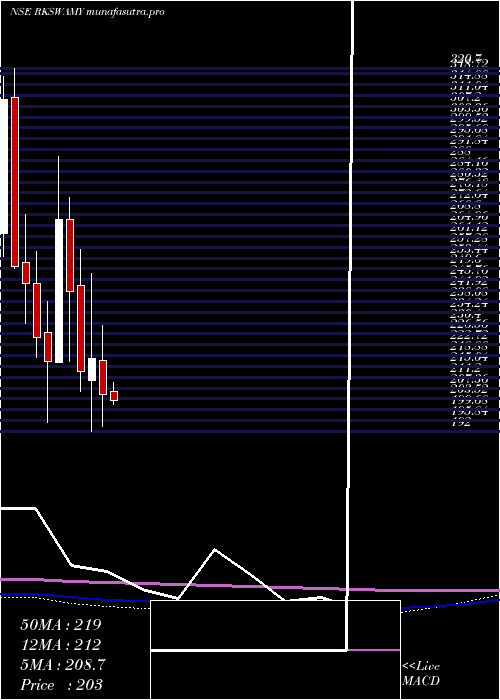
Daily price and charts and targets RK Strong Daily Stock price targets for RK RKSWAMY are 129.24 and 133.24 | Daily Target 1 | 128.49 | | Daily Target 2 | 129.99 | | Daily Target 3 | 132.49333333333 | | Daily Target 4 | 133.99 | | Daily Target 5 | 136.49 |
Daily price and volume R K
| Date |
Closing |
Open |
Range |
Volume |
Tue 28 October 2025 |
131.48 (-1.88%) |
134.60 |
131.00 - 135.00 |
2.0253 times |
Mon 27 October 2025 |
134.00 (0.77%) |
133.01 |
131.32 - 134.49 |
0.6995 times |
Fri 24 October 2025 |
132.98 (-0.4%) |
134.75 |
132.67 - 134.98 |
1.5445 times |
Thu 23 October 2025 |
133.51 (-0.79%) |
134.50 |
132.20 - 135.17 |
1.1709 times |
Tue 21 October 2025 |
134.57 (-0.47%) |
136.00 |
133.80 - 136.10 |
0.3162 times |
Mon 20 October 2025 |
135.21 (-1.93%) |
139.90 |
134.85 - 139.90 |
1.2525 times |
Fri 17 October 2025 |
137.87 (-2.18%) |
140.38 |
135.50 - 140.38 |
0.9816 times |
Thu 16 October 2025 |
140.94 (3.98%) |
137.00 |
136.29 - 142.00 |
0.6387 times |
Wed 15 October 2025 |
135.54 (-0.13%) |
138.74 |
134.70 - 138.74 |
0.5767 times |
Tue 14 October 2025 |
135.71 (-1.82%) |
141.99 |
133.10 - 141.99 |
0.794 times |
Mon 13 October 2025 |
138.22 (-2.09%) |
141.17 |
137.99 - 141.18 |
0.7372 times |
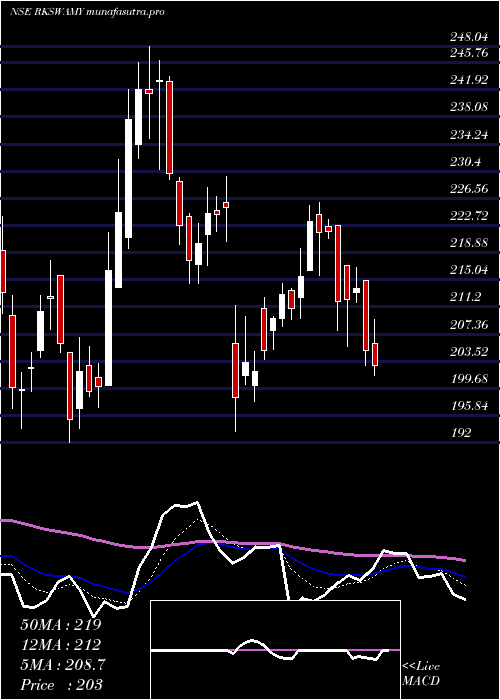
Weekly price and charts RK Strong weekly Stock price targets for RK RKSWAMY are 129.24 and 133.24 | Weekly Target 1 | 128.49 | | Weekly Target 2 | 129.99 | | Weekly Target 3 | 132.49333333333 | | Weekly Target 4 | 133.99 | | Weekly Target 5 | 136.49 |
Weekly price and volumes for R K
| Date |
Closing |
Open |
Range |
Volume |
Tue 28 October 2025 |
131.48 (-1.13%) |
133.01 |
131.00 - 135.00 |
0.7958 times |
Fri 24 October 2025 |
132.98 (-3.55%) |
139.90 |
132.20 - 139.90 |
1.2512 times |
Fri 17 October 2025 |
137.87 (-2.34%) |
141.17 |
133.10 - 142.00 |
1.0888 times |
Fri 10 October 2025 |
141.17 (-5.22%) |
148.95 |
140.05 - 150.01 |
0.6802 times |
Fri 03 October 2025 |
148.95 (2.39%) |
146.10 |
140.10 - 150.85 |
0.9696 times |
Fri 26 September 2025 |
145.48 (-6.41%) |
154.68 |
144.56 - 158.50 |
1.02 times |
Fri 19 September 2025 |
155.45 (-0.17%) |
156.60 |
150.56 - 163.89 |
1.8068 times |
Fri 12 September 2025 |
155.72 (1.84%) |
153.79 |
150.18 - 158.95 |
1.0007 times |
Fri 05 September 2025 |
152.91 (1.91%) |
151.55 |
149.26 - 156.39 |
0.9088 times |
Fri 29 August 2025 |
150.05 (-5.97%) |
157.97 |
149.90 - 159.96 |
0.4779 times |
Fri 22 August 2025 |
159.57 (4.44%) |
152.80 |
152.80 - 162.90 |
0.925 times |
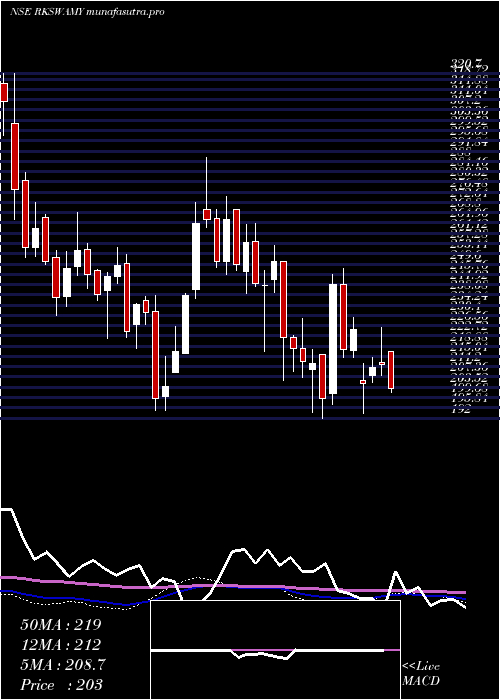
Monthly price and charts RK Strong monthly Stock price targets for RK RKSWAMY are 121.74 and 140.75 | Monthly Target 1 | 118.49 | | Monthly Target 2 | 124.98 | | Monthly Target 3 | 137.49666666667 | | Monthly Target 4 | 143.99 | | Monthly Target 5 | 156.51 |
Monthly price and volumes R K
| Date |
Closing |
Open |
Range |
Volume |
Tue 28 October 2025 |
131.48 (-9.96%) |
146.02 |
131.00 - 150.01 |
0.5122 times |
Tue 30 September 2025 |
146.02 (-2.69%) |
151.55 |
140.41 - 163.89 |
0.6321 times |
Fri 29 August 2025 |
150.05 (-10.3%) |
165.60 |
149.90 - 167.83 |
0.461 times |
Thu 31 July 2025 |
167.28 (-12.39%) |
189.00 |
155.00 - 191.84 |
0.8345 times |
Mon 30 June 2025 |
190.94 (0.12%) |
190.10 |
184.24 - 208.40 |
1.8082 times |
Fri 30 May 2025 |
190.72 (-7.01%) |
206.05 |
181.83 - 224.90 |
1.4971 times |
Wed 30 April 2025 |
205.10 (-5.8%) |
217.25 |
193.65 - 229.61 |
0.672 times |
Fri 28 March 2025 |
217.73 (2.11%) |
210.00 |
192.00 - 248.04 |
1.984 times |
Fri 28 February 2025 |
213.23 (-11.8%) |
243.89 |
206.00 - 256.41 |
0.748 times |
Fri 31 January 2025 |
241.75 (-9.51%) |
267.20 |
216.80 - 275.00 |
0.851 times |
Tue 31 December 2024 |
267.16 (23.19%) |
216.25 |
216.25 - 289.44 |
2.5647 times |
DMA SMA EMA moving averages of R K RKSWAMY
DMA (daily moving average) of R K RKSWAMY
| DMA period | DMA value | | 5 day DMA | 133.31 | | 12 day DMA | 135.93 | | 20 day DMA | 139.26 | | 35 day DMA | 145.62 | | 50 day DMA | 148.17 | | 100 day DMA | 162.74 | | 150 day DMA | 178.55 | | 200 day DMA | 191.59 | EMA (exponential moving average) of R K RKSWAMY
| EMA period | EMA current | EMA prev | EMA prev2 | | 5 day EMA | 133.46 | 134.45 | 134.67 | | 12 day EMA | 136.18 | 137.04 | 137.59 | | 20 day EMA | 139.12 | 139.92 | 140.54 | | 35 day EMA | 143.05 | 143.73 | 144.3 | | 50 day EMA | 147.23 | 147.87 | 148.44 |
SMA (simple moving average) of R K RKSWAMY
| SMA period | SMA current | SMA prev | SMA prev2 | | 5 day SMA | 133.31 | 134.05 | 134.83 | | 12 day SMA | 135.93 | 136.71 | 137.38 | | 20 day SMA | 139.26 | 139.96 | 140.77 | | 35 day SMA | 145.62 | 146.24 | 146.73 | | 50 day SMA | 148.17 | 148.62 | 149.02 | | 100 day SMA | 162.74 | 163.39 | 163.92 | | 150 day SMA | 178.55 | 179.17 | 179.72 | | 200 day SMA | 191.59 | 192.22 | 192.88 |
|
|
