Rites RITES full analysis,charts,indicators,moving averages,SMA,DMA,EMA,ADX,MACD,RSIRites RITES WideScreen charts, DMA,SMA,EMA technical analysis, forecast prediction, by indicators ADX,MACD,RSI,CCI NSE stock exchange
Daily price and charts and targets Rites Strong Daily Stock price targets for Rites RITES are 242.73 and 245.42 | Daily Target 1 | 242.26 | | Daily Target 2 | 243.2 | | Daily Target 3 | 244.94666666667 | | Daily Target 4 | 245.89 | | Daily Target 5 | 247.64 |
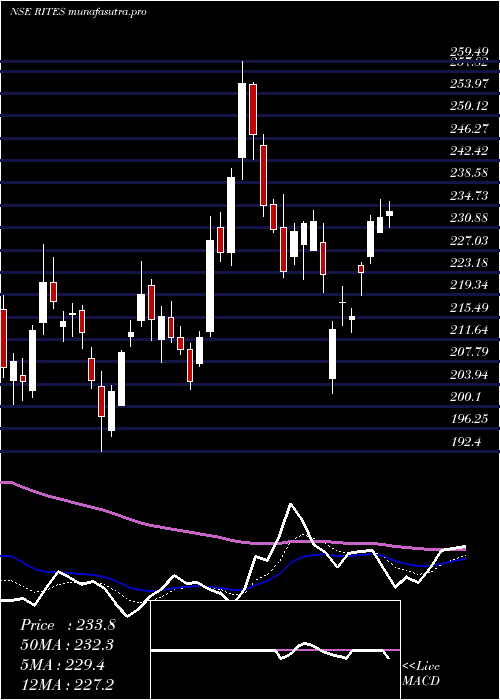
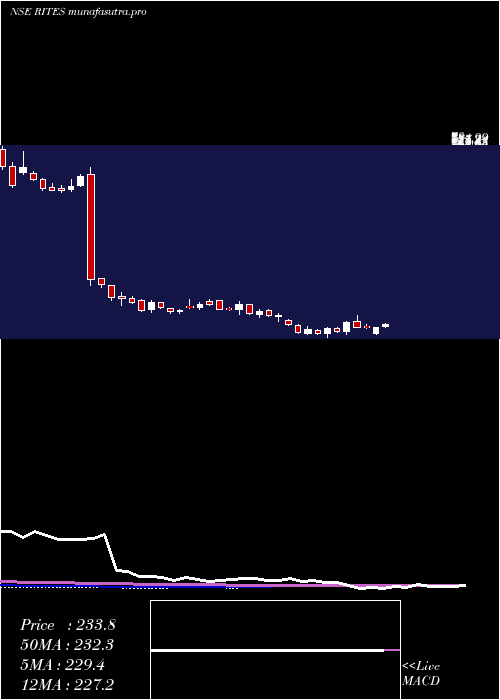
Daily price and volume Rites
| Date |
Closing |
Open |
Range |
Volume |
Tue 28 October 2025 |
244.15 (-0.63%) |
245.69 |
244.00 - 246.69 |
0.935 times |
Mon 27 October 2025 |
245.69 (-0.38%) |
247.70 |
245.00 - 247.70 |
1.0246 times |
Fri 24 October 2025 |
246.63 (-0.71%) |
248.01 |
246.00 - 249.50 |
1.0904 times |
Thu 23 October 2025 |
248.39 (0.04%) |
250.66 |
247.70 - 250.88 |
1.4309 times |
Tue 21 October 2025 |
248.28 (0.13%) |
245.81 |
245.81 - 249.90 |
0.4762 times |
Mon 20 October 2025 |
247.97 (-0.17%) |
248.39 |
246.61 - 249.49 |
1.0671 times |
Fri 17 October 2025 |
248.38 (-1.3%) |
251.02 |
246.17 - 251.23 |
1.0784 times |
Thu 16 October 2025 |
251.65 (0.56%) |
251.00 |
250.00 - 253.75 |
0.925 times |
Wed 15 October 2025 |
250.26 (0.28%) |
248.51 |
248.51 - 251.12 |
0.8732 times |
Tue 14 October 2025 |
249.56 (-1.02%) |
252.14 |
249.00 - 253.50 |
1.0992 times |
Mon 13 October 2025 |
252.14 (-0.94%) |
253.22 |
250.33 - 253.49 |
1.0695 times |
Weekly price and charts Rites Strong weekly Stock price targets for Rites RITES are 242.23 and 245.93 | Weekly Target 1 | 241.58 | | Weekly Target 2 | 242.87 | | Weekly Target 3 | 245.28333333333 | | Weekly Target 4 | 246.57 | | Weekly Target 5 | 248.98 |
Weekly price and volumes for Rites
| Date |
Closing |
Open |
Range |
Volume |
Tue 28 October 2025 |
244.15 (-1.01%) |
247.70 |
244.00 - 247.70 |
0.086 times |
Fri 24 October 2025 |
246.63 (-0.7%) |
248.39 |
245.81 - 250.88 |
0.1784 times |
Fri 17 October 2025 |
248.38 (-2.41%) |
253.22 |
246.17 - 253.75 |
0.2215 times |
Fri 10 October 2025 |
254.52 (0.22%) |
253.74 |
250.97 - 258.18 |
0.3951 times |
Fri 03 October 2025 |
253.96 (2.28%) |
249.00 |
245.00 - 255.00 |
0.7728 times |
Fri 26 September 2025 |
248.31 (-8.87%) |
269.00 |
241.15 - 272.51 |
5.9725 times |
Fri 19 September 2025 |
272.47 (1.71%) |
267.91 |
267.91 - 280.90 |
0.841 times |
Fri 12 September 2025 |
267.90 (2.18%) |
262.19 |
259.61 - 273.91 |
0.6536 times |
Fri 05 September 2025 |
262.19 (7.48%) |
247.00 |
245.85 - 267.99 |
0.6988 times |
Fri 29 August 2025 |
243.95 (-4.73%) |
256.45 |
242.50 - 257.05 |
0.1803 times |
Fri 22 August 2025 |
256.05 (2.22%) |
251.50 |
250.00 - 260.55 |
0.29 times |
Monthly price and charts Rites Strong monthly Stock price targets for Rites RITES are 236.99 and 251.17 | Monthly Target 1 | 234.6 | | Monthly Target 2 | 239.37 | | Monthly Target 3 | 248.77666666667 | | Monthly Target 4 | 253.55 | | Monthly Target 5 | 262.96 |
Monthly price and volumes Rites
| Date |
Closing |
Open |
Range |
Volume |
Tue 28 October 2025 |
244.15 (-0.77%) |
249.90 |
244.00 - 258.18 |
0.2159 times |
Tue 30 September 2025 |
246.04 (0.86%) |
247.00 |
241.15 - 280.90 |
1.4739 times |
Fri 29 August 2025 |
243.95 (-4.99%) |
258.00 |
242.50 - 263.25 |
0.1849 times |
Thu 31 July 2025 |
256.75 (-8.3%) |
280.60 |
254.45 - 299.80 |
1.1447 times |
Mon 30 June 2025 |
280.00 (0.92%) |
277.00 |
268.00 - 316.00 |
1.4777 times |
Fri 30 May 2025 |
277.44 (23.24%) |
224.90 |
212.00 - 303.40 |
1.8233 times |
Wed 30 April 2025 |
225.12 (0.78%) |
226.00 |
202.43 - 248.00 |
0.4408 times |
Fri 28 March 2025 |
223.37 (9.2%) |
203.55 |
192.40 - 259.49 |
1.1082 times |
Fri 28 February 2025 |
204.55 (-21.58%) |
246.00 |
200.50 - 249.60 |
0.8794 times |
Fri 31 January 2025 |
260.85 (-10.56%) |
292.00 |
243.15 - 304.90 |
1.2512 times |
Tue 31 December 2024 |
291.65 (2.41%) |
285.05 |
265.20 - 309.85 |
2.3862 times |

DMA SMA EMA moving averages of Rites RITES
DMA (daily moving average) of Rites RITES
| DMA period | DMA value | | 5 day DMA | 246.63 | | 12 day DMA | 248.97 | | 20 day DMA | 250.1 | | 35 day DMA | 256.71 | | 50 day DMA | 256.26 | | 100 day DMA | 265.87 | | 150 day DMA | 258.96 | | 200 day DMA | 252.93 | EMA (exponential moving average) of Rites RITES
| EMA period | EMA current | EMA prev | EMA prev2 | | 5 day EMA | 246.27 | 247.33 | 248.15 | | 12 day EMA | 248.55 | 249.35 | 250.01 | | 20 day EMA | 250.56 | 251.23 | 251.81 | | 35 day EMA | 252.42 | 252.91 | 253.34 | | 50 day EMA | 254.74 | 255.17 | 255.56 |
SMA (simple moving average) of Rites RITES
| SMA period | SMA current | SMA prev | SMA prev2 | | 5 day SMA | 246.63 | 247.39 | 247.93 | | 12 day SMA | 248.97 | 249.64 | 250.31 | | 20 day SMA | 250.1 | 250.31 | 250.64 | | 35 day SMA | 256.71 | 257.23 | 257.57 | | 50 day SMA | 256.26 | 256.39 | 256.45 | | 100 day SMA | 265.87 | 266.39 | 266.73 | | 150 day SMA | 258.96 | 258.86 | 258.63 | | 200 day SMA | 252.93 | 253.13 | 253.38 |
|
|
