RachanaInfra RILINFRA_SM full analysis,charts,indicators,moving averages,SMA,DMA,EMA,ADX,MACD,RSIRachana Infra RILINFRA_SM WideScreen charts, DMA,SMA,EMA technical analysis, forecast prediction, by indicators ADX,MACD,RSI,CCI NSE stock exchange
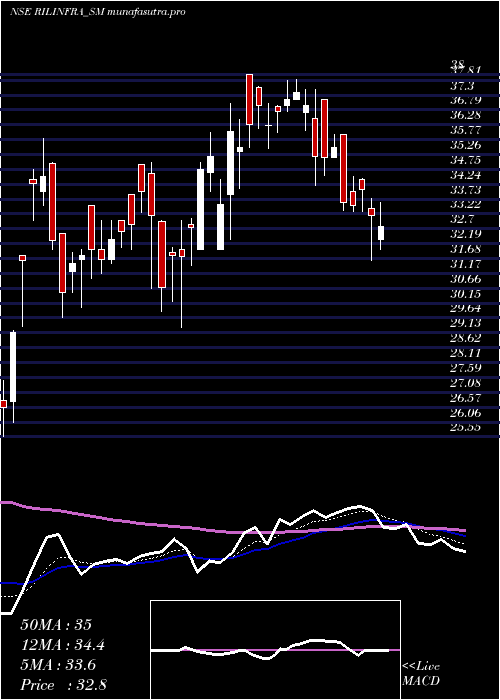
Daily price and charts and targets RachanaInfra Strong Daily Stock price targets for RachanaInfra RILINFRA_SM are 35.6 and 38.15 | Daily Target 1 | 33.72 | | Daily Target 2 | 34.93 | | Daily Target 3 | 36.266666666667 | | Daily Target 4 | 37.48 | | Daily Target 5 | 38.82 |
Daily price and volume Rachana Infra
| Date |
Closing |
Open |
Range |
Volume |
Wed 29 October 2025 |
36.15 (-0.96%) |
35.05 |
35.05 - 37.60 |
1.1787 times |
Tue 28 October 2025 |
36.50 (-1.35%) |
37.00 |
36.00 - 37.80 |
0.6882 times |
Mon 27 October 2025 |
37.00 (-0.94%) |
36.60 |
35.70 - 38.80 |
0.5703 times |
Fri 24 October 2025 |
37.35 (-2.48%) |
39.25 |
37.35 - 39.25 |
0.8251 times |
Thu 23 October 2025 |
38.30 (5.51%) |
36.35 |
36.35 - 41.90 |
4.6882 times |
Tue 21 October 2025 |
36.30 (3.12%) |
35.50 |
35.00 - 36.70 |
0.4335 times |
Mon 20 October 2025 |
35.20 (6.02%) |
32.65 |
32.65 - 37.05 |
0.9087 times |
Fri 17 October 2025 |
33.20 (-0.6%) |
33.25 |
32.90 - 33.65 |
0.2586 times |
Thu 16 October 2025 |
33.40 (0.6%) |
33.20 |
32.80 - 34.90 |
0.3422 times |
Wed 15 October 2025 |
33.20 (-0.75%) |
33.05 |
33.00 - 33.25 |
0.1065 times |
Tue 14 October 2025 |
33.45 (0.15%) |
33.25 |
32.40 - 33.95 |
0.3764 times |
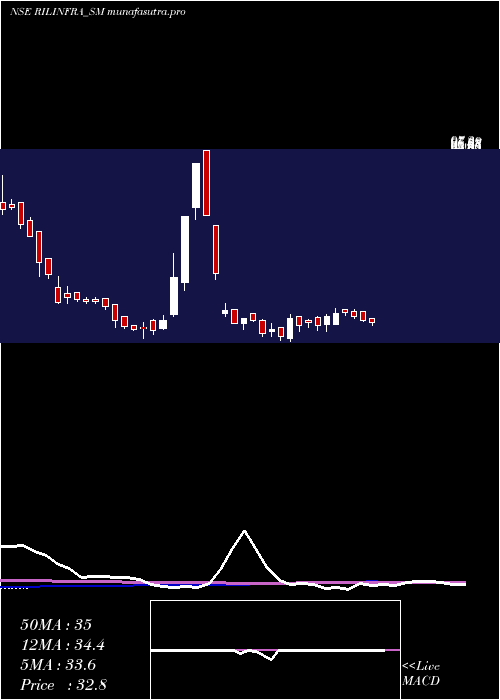
Weekly price and charts RachanaInfra Strong weekly Stock price targets for RachanaInfra RILINFRA_SM are 33.73 and 37.48 | Weekly Target 1 | 32.92 | | Weekly Target 2 | 34.53 | | Weekly Target 3 | 36.666666666667 | | Weekly Target 4 | 38.28 | | Weekly Target 5 | 40.42 |
Weekly price and volumes for Rachana Infra
| Date |
Closing |
Open |
Range |
Volume |
Wed 29 October 2025 |
36.15 (-3.21%) |
36.60 |
35.05 - 38.80 |
0.3893 times |
Fri 24 October 2025 |
37.35 (12.5%) |
32.65 |
32.65 - 41.90 |
1.0951 times |
Fri 17 October 2025 |
33.20 (-0.3%) |
33.95 |
32.40 - 34.95 |
0.1986 times |
Fri 10 October 2025 |
33.30 (-4.31%) |
34.00 |
32.65 - 35.00 |
0.3626 times |
Fri 03 October 2025 |
34.80 (2.05%) |
34.60 |
33.60 - 35.30 |
0.1075 times |
Fri 26 September 2025 |
34.10 (-3.67%) |
35.40 |
34.00 - 36.15 |
0.3086 times |
Fri 19 September 2025 |
35.40 (-2.75%) |
36.40 |
35.00 - 37.00 |
0.3207 times |
Fri 12 September 2025 |
36.40 (-23.93%) |
36.00 |
35.40 - 37.80 |
0.3122 times |
Fri 06 June 2025 |
47.85 (36.32%) |
35.40 |
34.70 - 53.90 |
5.7428 times |
Fri 30 May 2025 |
35.10 (4.46%) |
34.85 |
33.60 - 36.10 |
1.1625 times |
Fri 23 May 2025 |
33.60 (-0.88%) |
33.50 |
32.55 - 34.90 |
0.4045 times |
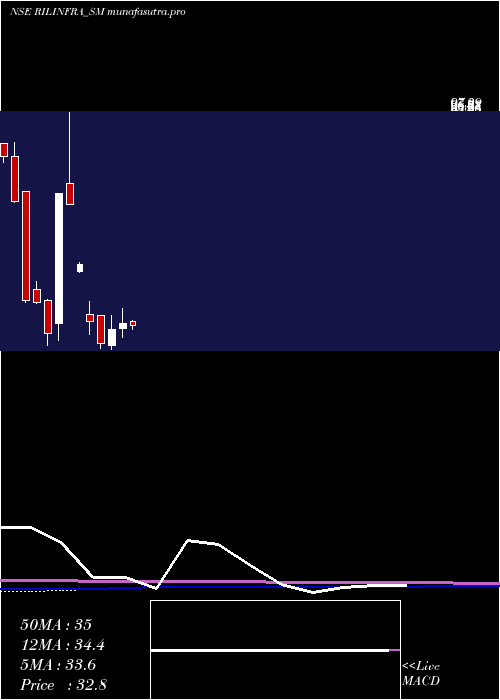
Monthly price and charts RachanaInfra Strong monthly Stock price targets for RachanaInfra RILINFRA_SM are 34.28 and 43.78 | Monthly Target 1 | 27.32 | | Monthly Target 2 | 31.73 | | Monthly Target 3 | 36.816666666667 | | Monthly Target 4 | 41.23 | | Monthly Target 5 | 46.32 |
Monthly price and volumes Rachana Infra
| Date |
Closing |
Open |
Range |
Volume |
Wed 29 October 2025 |
36.15 (4.93%) |
34.80 |
32.40 - 41.90 |
0.4452 times |
Tue 30 September 2025 |
34.45 (-28%) |
36.00 |
33.60 - 37.80 |
0.2077 times |
Fri 06 June 2025 |
47.85 (36.32%) |
35.40 |
34.70 - 53.90 |
1.2117 times |
Fri 30 May 2025 |
35.10 (4.46%) |
34.00 |
30.00 - 36.10 |
0.6067 times |
Wed 30 April 2025 |
33.60 (5.66%) |
32.00 |
29.30 - 38.00 |
0.5238 times |
Fri 28 March 2025 |
31.80 (15.85%) |
26.80 |
25.55 - 35.80 |
1.0078 times |
Fri 28 February 2025 |
27.45 (-19.85%) |
36.05 |
26.10 - 36.05 |
0.8157 times |
Fri 31 January 2025 |
34.25 (-33.17%) |
36.10 |
30.15 - 40.15 |
1.7158 times |
Tue 08 October 2024 |
51.25 (-26.1%) |
49.20 |
49.00 - 52.00 |
0.0242 times |
Mon 15 July 2024 |
69.35 (-4.48%) |
75.85 |
69.35 - 97.20 |
3.4412 times |
Fri 28 June 2024 |
72.60 (137.25%) |
33.60 |
28.45 - 72.60 |
7.3788 times |
DMA SMA EMA moving averages of Rachana Infra RILINFRA_SM
DMA (daily moving average) of Rachana Infra RILINFRA_SM
| DMA period | DMA value | | 5 day DMA | 37.06 | | 12 day DMA | 35.29 | | 20 day DMA | 34.79 | | 35 day DMA | 35.14 | | 50 day DMA | 35.81 | | 100 day DMA | 34.52 | | 150 day DMA | 38.84 | | 200 day DMA | 37.98 | EMA (exponential moving average) of Rachana Infra RILINFRA_SM
| EMA period | EMA current | EMA prev | EMA prev2 | | 5 day EMA | 36.43 | 36.57 | 36.6 | | 12 day EMA | 35.77 | 35.7 | 35.55 | | 20 day EMA | 35.41 | 35.33 | 35.21 | | 35 day EMA | 35.41 | 35.37 | 35.3 | | 50 day EMA | 35.7 | 35.68 | 35.65 |
SMA (simple moving average) of Rachana Infra RILINFRA_SM
| SMA period | SMA current | SMA prev | SMA prev2 | | 5 day SMA | 37.06 | 37.09 | 36.83 | | 12 day SMA | 35.29 | 35.05 | 34.76 | | 20 day SMA | 34.79 | 34.69 | 34.57 | | 35 day SMA | 35.14 | 35.14 | 35.47 | | 50 day SMA | 35.81 | 35.77 | 35.72 | | 100 day SMA | 34.52 | 34.46 | 34.4 | | 150 day SMA | 38.84 | 38.96 | 39.04 | | 200 day SMA | 37.98 | 38.01 | 38.04 |
|
|
