RenaissanceGlobal RGL full analysis,charts,indicators,moving averages,SMA,DMA,EMA,ADX,MACD,RSIRenaissance Global RGL WideScreen charts, DMA,SMA,EMA technical analysis, forecast prediction, by indicators ADX,MACD,RSI,CCI NSE stock exchange
Daily price and charts and targets RenaissanceGlobal Strong Daily Stock price targets for RenaissanceGlobal RGL are 130.65 and 134.9 | Daily Target 1 | 129.56 | | Daily Target 2 | 131.74 | | Daily Target 3 | 133.81333333333 | | Daily Target 4 | 135.99 | | Daily Target 5 | 138.06 |
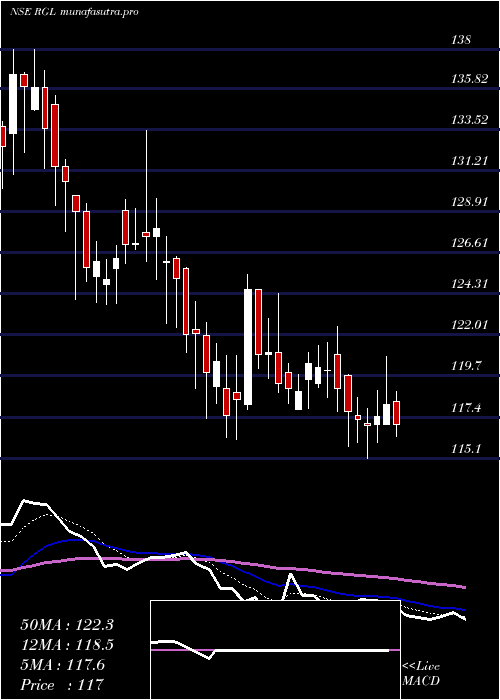
Daily price and volume Renaissance Global
| Date |
Closing |
Open |
Range |
Volume |
Tue 28 October 2025 |
133.91 (-0.87%) |
134.50 |
131.64 - 135.89 |
0.557 times |
Mon 27 October 2025 |
135.09 (0.05%) |
134.87 |
133.00 - 136.63 |
0.7117 times |
Fri 24 October 2025 |
135.02 (-1.87%) |
138.15 |
133.00 - 139.00 |
0.7949 times |
Thu 23 October 2025 |
137.60 (-1.79%) |
140.11 |
135.75 - 141.50 |
0.8071 times |
Tue 21 October 2025 |
140.11 (0.8%) |
140.60 |
137.85 - 142.50 |
0.6316 times |
Mon 20 October 2025 |
139.00 (4.28%) |
132.70 |
131.22 - 141.00 |
2.6386 times |
Fri 17 October 2025 |
133.30 (0.31%) |
132.00 |
130.65 - 134.90 |
0.7224 times |
Thu 16 October 2025 |
132.89 (1.04%) |
131.90 |
130.20 - 133.35 |
0.48 times |
Wed 15 October 2025 |
131.52 (-0.7%) |
133.30 |
129.75 - 133.65 |
0.6091 times |
Tue 14 October 2025 |
132.45 (-0.73%) |
134.40 |
126.86 - 134.42 |
2.0476 times |
Mon 13 October 2025 |
133.42 (-1.51%) |
135.46 |
131.60 - 139.21 |
1.5069 times |
Weekly price and charts RenaissanceGlobal Strong weekly Stock price targets for RenaissanceGlobal RGL are 130.28 and 135.27 | Weekly Target 1 | 129.07 | | Weekly Target 2 | 131.49 | | Weekly Target 3 | 134.06 | | Weekly Target 4 | 136.48 | | Weekly Target 5 | 139.05 |
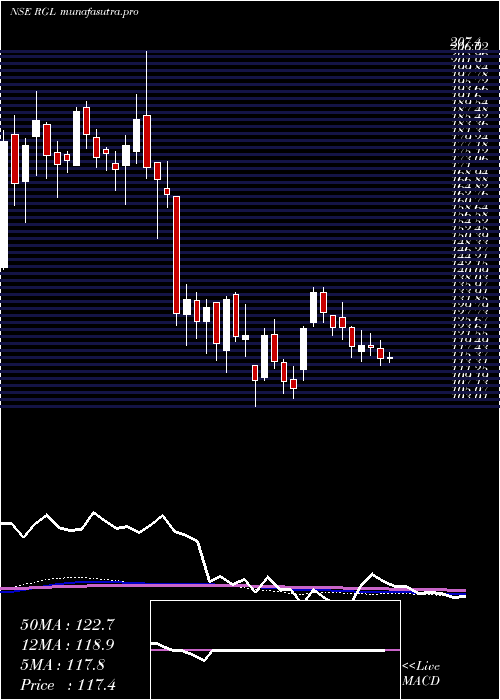
Weekly price and volumes for Renaissance Global
| Date |
Closing |
Open |
Range |
Volume |
Tue 28 October 2025 |
133.91 (-0.82%) |
134.87 |
131.64 - 136.63 |
0.2732 times |
Fri 24 October 2025 |
135.02 (1.29%) |
132.70 |
131.22 - 142.50 |
1.0494 times |
Fri 17 October 2025 |
133.30 (-1.59%) |
135.46 |
126.86 - 139.21 |
1.1557 times |
Fri 10 October 2025 |
135.46 (12.39%) |
118.54 |
118.00 - 138.50 |
2.6009 times |
Fri 03 October 2025 |
120.53 (5.95%) |
113.15 |
111.52 - 123.98 |
1.9153 times |
Fri 26 September 2025 |
113.76 (-5.39%) |
119.05 |
110.42 - 123.76 |
0.6543 times |
Fri 19 September 2025 |
120.24 (1.43%) |
119.08 |
118.02 - 127.68 |
0.7289 times |
Fri 12 September 2025 |
118.55 (4.74%) |
113.70 |
113.70 - 123.00 |
0.6677 times |
Fri 05 September 2025 |
113.18 (1.86%) |
109.91 |
107.65 - 114.80 |
0.4874 times |
Fri 29 August 2025 |
111.11 (-3.13%) |
114.23 |
106.43 - 117.52 |
0.4672 times |
Fri 22 August 2025 |
114.70 (8.54%) |
106.08 |
105.21 - 119.80 |
0.4721 times |
Monthly price and charts RenaissanceGlobal Strong monthly Stock price targets for RenaissanceGlobal RGL are 124.02 and 152.39 | Monthly Target 1 | 101.81 | | Monthly Target 2 | 117.86 | | Monthly Target 3 | 130.18 | | Monthly Target 4 | 146.23 | | Monthly Target 5 | 158.55 |
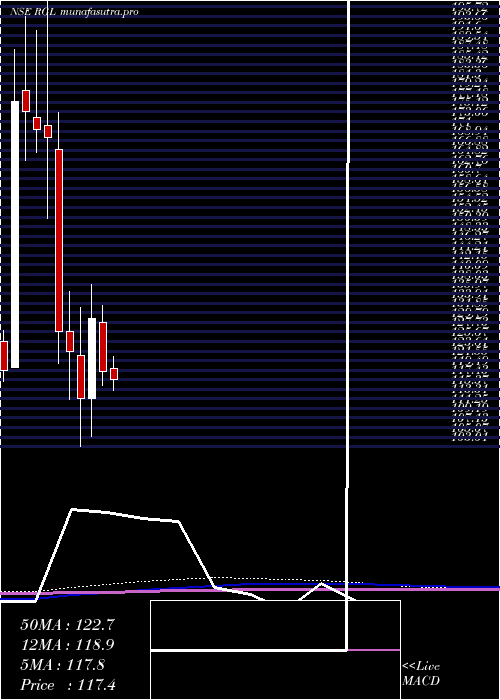
Monthly price and volumes Renaissance Global
| Date |
Closing |
Open |
Range |
Volume |
Tue 28 October 2025 |
133.91 (17.17%) |
114.25 |
114.13 - 142.50 |
1.5662 times |
Tue 30 September 2025 |
114.29 (2.86%) |
109.91 |
107.65 - 127.68 |
1.002 times |
Fri 29 August 2025 |
111.11 (-2.27%) |
112.45 |
103.52 - 121.00 |
0.9957 times |
Thu 31 July 2025 |
113.69 (-4.69%) |
119.90 |
103.60 - 122.48 |
0.5502 times |
Mon 30 June 2025 |
119.29 (-8.65%) |
129.80 |
116.16 - 133.45 |
0.6439 times |
Fri 30 May 2025 |
130.58 (15.12%) |
113.43 |
105.26 - 138.00 |
0.9471 times |
Wed 30 April 2025 |
113.43 (-8.2%) |
122.55 |
103.01 - 133.00 |
0.7558 times |
Fri 28 March 2025 |
123.56 (-3.33%) |
127.82 |
113.08 - 136.40 |
0.9163 times |
Fri 28 February 2025 |
127.82 (-24.67%) |
167.00 |
121.00 - 175.00 |
0.8475 times |
Fri 31 January 2025 |
169.68 (-0.95%) |
172.16 |
152.25 - 207.40 |
1.7753 times |
Tue 31 December 2024 |
171.31 (-2.27%) |
173.87 |
166.42 - 192.60 |
0.8334 times |
DMA SMA EMA moving averages of Renaissance Global RGL
DMA (daily moving average) of Renaissance Global RGL
| DMA period | DMA value | | 5 day DMA | 136.35 | | 12 day DMA | 134.98 | | 20 day DMA | 129.68 | | 35 day DMA | 125.13 | | 50 day DMA | 120.96 | | 100 day DMA | 119.58 | | 150 day DMA | 120.58 | | 200 day DMA | 128.66 | EMA (exponential moving average) of Renaissance Global RGL
| EMA period | EMA current | EMA prev | EMA prev2 | | 5 day EMA | 135.2 | 135.85 | 136.23 | | 12 day EMA | 133.63 | 133.58 | 133.31 | | 20 day EMA | 130.81 | 130.48 | 129.99 | | 35 day EMA | 126.12 | 125.66 | 125.1 | | 50 day EMA | 121.4 | 120.89 | 120.31 |
SMA (simple moving average) of Renaissance Global RGL
| SMA period | SMA current | SMA prev | SMA prev2 | | 5 day SMA | 136.35 | 137.36 | 137.01 | | 12 day SMA | 134.98 | 135.15 | 134.59 | | 20 day SMA | 129.68 | 128.68 | 127.82 | | 35 day SMA | 125.13 | 124.54 | 123.79 | | 50 day SMA | 120.96 | 120.44 | 119.85 | | 100 day SMA | 119.58 | 119.5 | 119.41 | | 150 day SMA | 120.58 | 120.52 | 120.42 | | 200 day SMA | 128.66 | 128.82 | 129 |
|
|
