RavindraEnergy RELTD full analysis,charts,indicators,moving averages,SMA,DMA,EMA,ADX,MACD,RSIRavindra Energy RELTD WideScreen charts, DMA,SMA,EMA technical analysis, forecast prediction, by indicators ADX,MACD,RSI,CCI NSE stock exchange
Daily price and charts and targets RavindraEnergy Strong Daily Stock price targets for RavindraEnergy RELTD are 142.5 and 151.54 | Daily Target 1 | 140.57 | | Daily Target 2 | 144.42 | | Daily Target 3 | 149.61 | | Daily Target 4 | 153.46 | | Daily Target 5 | 158.65 |
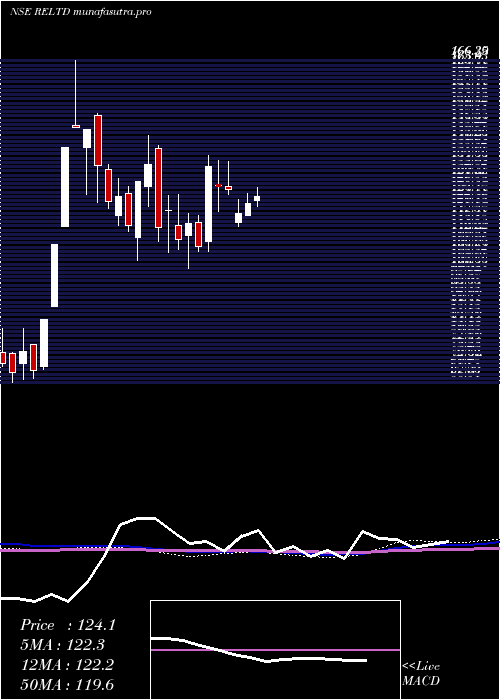
Daily price and volume Ravindra Energy
| Date |
Closing |
Open |
Range |
Volume |
Tue 28 October 2025 |
148.27 (-1.78%) |
153.00 |
145.76 - 154.80 |
1.0561 times |
Mon 27 October 2025 |
150.95 (6.28%) |
142.03 |
140.00 - 152.45 |
2.0466 times |
Fri 24 October 2025 |
142.03 (-1.63%) |
144.01 |
141.00 - 144.39 |
0.5799 times |
Thu 23 October 2025 |
144.38 (-2.75%) |
150.74 |
142.50 - 151.30 |
0.7756 times |
Tue 21 October 2025 |
148.46 (3.15%) |
144.00 |
144.00 - 149.89 |
0.387 times |
Mon 20 October 2025 |
143.93 (1.26%) |
142.35 |
140.56 - 147.12 |
0.6191 times |
Fri 17 October 2025 |
142.14 (-2.71%) |
149.90 |
140.00 - 149.90 |
0.8023 times |
Thu 16 October 2025 |
146.10 (0.59%) |
148.90 |
143.69 - 148.90 |
0.7768 times |
Wed 15 October 2025 |
145.25 (2.32%) |
142.89 |
141.41 - 149.01 |
2.0953 times |
Tue 14 October 2025 |
141.95 (-2.55%) |
145.00 |
140.00 - 146.80 |
0.8612 times |
Mon 13 October 2025 |
145.66 (-4.49%) |
150.22 |
143.44 - 151.94 |
1.1257 times |

Weekly price and charts RavindraEnergy Strong weekly Stock price targets for RavindraEnergy RELTD are 144.14 and 158.94 | Weekly Target 1 | 132.89 | | Weekly Target 2 | 140.58 | | Weekly Target 3 | 147.69 | | Weekly Target 4 | 155.38 | | Weekly Target 5 | 162.49 |
Weekly price and volumes for Ravindra Energy
| Date |
Closing |
Open |
Range |
Volume |
Tue 28 October 2025 |
148.27 (4.39%) |
142.03 |
140.00 - 154.80 |
0.2887 times |
Fri 24 October 2025 |
142.03 (-0.08%) |
142.35 |
140.56 - 151.30 |
0.2197 times |
Fri 17 October 2025 |
142.14 (-6.8%) |
150.22 |
140.00 - 151.94 |
0.5267 times |
Fri 10 October 2025 |
152.51 (-8%) |
167.70 |
152.00 - 174.06 |
0.6541 times |
Fri 03 October 2025 |
165.78 (1.1%) |
167.90 |
156.10 - 169.67 |
0.487 times |
Fri 26 September 2025 |
163.97 (-10.22%) |
184.00 |
163.00 - 191.77 |
1.7277 times |
Fri 19 September 2025 |
182.64 (15.07%) |
162.00 |
160.00 - 188.43 |
1.8446 times |
Fri 12 September 2025 |
158.72 (5.27%) |
150.80 |
141.90 - 158.72 |
1.0461 times |
Fri 13 June 2025 |
150.77 (-1.1%) |
143.35 |
143.35 - 161.80 |
1.6654 times |
Fri 06 June 2025 |
152.44 (-6.09%) |
165.00 |
149.43 - 165.00 |
1.54 times |
Fri 30 May 2025 |
162.32 (48.44%) |
110.45 |
107.31 - 165.00 |
5.5244 times |
Monthly price and charts RavindraEnergy Strong monthly Stock price targets for RavindraEnergy RELTD are 127.11 and 161.17 | Monthly Target 1 | 120.05 | | Monthly Target 2 | 134.16 | | Monthly Target 3 | 154.11 | | Monthly Target 4 | 168.22 | | Monthly Target 5 | 188.17 |
Monthly price and volumes Ravindra Energy
| Date |
Closing |
Open |
Range |
Volume |
Tue 28 October 2025 |
148.27 (-6.54%) |
158.97 |
140.00 - 174.06 |
0.785 times |
Tue 30 September 2025 |
158.65 (7.44%) |
152.00 |
144.15 - 191.77 |
1.7665 times |
Mon 16 June 2025 |
147.66 (-9.03%) |
165.00 |
141.90 - 165.00 |
1.4683 times |
Fri 30 May 2025 |
162.32 (48.18%) |
109.00 |
93.41 - 165.00 |
3.0261 times |
Wed 30 April 2025 |
109.54 (-14.01%) |
127.00 |
108.00 - 135.00 |
0.4037 times |
Fri 28 March 2025 |
127.38 (15.2%) |
111.95 |
101.60 - 136.80 |
0.4953 times |
Fri 28 February 2025 |
110.57 (-14.13%) |
126.99 |
106.50 - 143.00 |
0.5672 times |
Fri 31 January 2025 |
128.77 (2.62%) |
124.99 |
104.16 - 138.66 |
0.5017 times |
Tue 31 December 2024 |
125.48 (-8.76%) |
123.54 |
122.00 - 126.78 |
0.0075 times |
Mon 07 October 2024 |
137.53 (-0.51%) |
131.32 |
124.75 - 150.00 |
0.9788 times |
Mon 30 September 2024 |
138.24 (98.59%) |
71.00 |
70.13 - 166.39 |
2.4196 times |

DMA SMA EMA moving averages of Ravindra Energy RELTD
DMA (daily moving average) of Ravindra Energy RELTD
| DMA period | DMA value | | 5 day DMA | 146.82 | | 12 day DMA | 145.97 | | 20 day DMA | 152.02 | | 35 day DMA | 158.34 | | 50 day DMA | 154.78 | | 100 day DMA | 135.45 | | 150 day DMA | 131.06 | | 200 day DMA | | EMA (exponential moving average) of Ravindra Energy RELTD
| EMA period | EMA current | EMA prev | EMA prev2 | | 5 day EMA | 147.14 | 146.58 | 144.4 | | 12 day EMA | 148.42 | 148.45 | 148 | | 20 day EMA | 150.72 | 150.98 | 150.98 | | 35 day EMA | 150.08 | 150.19 | 150.15 | | 50 day EMA | 150.5 | 150.59 | 150.58 |
SMA (simple moving average) of Ravindra Energy RELTD
| SMA period | SMA current | SMA prev | SMA prev2 | | 5 day SMA | 146.82 | 145.95 | 144.19 | | 12 day SMA | 145.97 | 146.48 | 146.9 | | 20 day SMA | 152.02 | 152.81 | 153.79 | | 35 day SMA | 158.34 | 158.41 | 158.45 | | 50 day SMA | 154.78 | 154 | 153.23 | | 100 day SMA | 135.45 | 135.12 | 134.75 | | 150 day SMA | 131.06 | 130.95 | 130.86 | | 200 day SMA |
|
|
