RegencyCeramics REGENCERAM full analysis,charts,indicators,moving averages,SMA,DMA,EMA,ADX,MACD,RSIRegency Ceramics REGENCERAM WideScreen charts, DMA,SMA,EMA technical analysis, forecast prediction, by indicators ADX,MACD,RSI,CCI NSE stock exchange
operates under Furniture-Furnishing-Paints sector
Daily price and charts and targets RegencyCeramics Strong Daily Stock price targets for RegencyCeramics REGENCERAM are 47.17 and 49.65 | Daily Target 1 | 45.2 | | Daily Target 2 | 46.66 | | Daily Target 3 | 47.676666666667 | | Daily Target 4 | 49.14 | | Daily Target 5 | 50.16 |
Daily price and volume Regency Ceramics
| Date |
Closing |
Open |
Range |
Volume |
Wed 29 October 2025 |
48.13 (3.08%) |
46.69 |
46.21 - 48.69 |
0.4317 times |
Tue 28 October 2025 |
46.69 (-1.93%) |
47.39 |
45.30 - 49.00 |
1.0762 times |
Mon 27 October 2025 |
47.61 (-4.67%) |
51.98 |
46.50 - 51.98 |
0.6945 times |
Fri 24 October 2025 |
49.94 (1.24%) |
49.33 |
44.44 - 52.99 |
2.424 times |
Thu 23 October 2025 |
49.33 (5.86%) |
44.38 |
44.38 - 54.99 |
3.3028 times |
Tue 21 October 2025 |
46.60 (3.51%) |
43.91 |
43.89 - 50.00 |
0.1688 times |
Mon 20 October 2025 |
45.02 (1.19%) |
44.71 |
44.50 - 46.68 |
0.5001 times |
Fri 17 October 2025 |
44.49 (-3.18%) |
46.79 |
43.30 - 46.79 |
0.7535 times |
Thu 16 October 2025 |
45.95 (-2.38%) |
45.44 |
45.44 - 47.97 |
0.1224 times |
Wed 15 October 2025 |
47.07 (3.66%) |
45.18 |
44.05 - 47.49 |
0.5259 times |
Tue 14 October 2025 |
45.41 (-3.2%) |
47.77 |
42.77 - 47.77 |
1.6834 times |
Weekly price and charts RegencyCeramics Strong weekly Stock price targets for RegencyCeramics REGENCERAM are 43.38 and 50.06 | Weekly Target 1 | 41.79 | | Weekly Target 2 | 44.96 | | Weekly Target 3 | 48.47 | | Weekly Target 4 | 51.64 | | Weekly Target 5 | 55.15 |
Weekly price and volumes for Regency Ceramics
| Date |
Closing |
Open |
Range |
Volume |
Wed 29 October 2025 |
48.13 (-3.62%) |
51.98 |
45.30 - 51.98 |
0.5049 times |
Fri 24 October 2025 |
49.94 (12.25%) |
44.71 |
43.89 - 54.99 |
1.4662 times |
Fri 17 October 2025 |
44.49 (4.88%) |
42.43 |
41.18 - 50.90 |
1.6332 times |
Fri 10 October 2025 |
42.42 (1.19%) |
44.98 |
40.00 - 44.98 |
0.7141 times |
Fri 03 October 2025 |
41.92 (2.07%) |
41.07 |
40.25 - 44.40 |
0.4027 times |
Fri 26 September 2025 |
41.07 (-4.58%) |
46.80 |
40.00 - 46.80 |
4.0556 times |
Fri 19 September 2025 |
43.04 (-7.76%) |
48.00 |
42.90 - 48.00 |
0.4239 times |
Fri 12 September 2025 |
46.66 (-0.41%) |
48.43 |
44.56 - 49.49 |
0.2095 times |
Fri 05 September 2025 |
46.85 (-2.13%) |
48.00 |
44.43 - 49.88 |
0.4744 times |
Fri 29 August 2025 |
47.87 (1.68%) |
47.09 |
46.32 - 49.98 |
0.1155 times |
Fri 22 August 2025 |
47.08 (-4.66%) |
51.74 |
45.95 - 51.74 |
0.1848 times |
Monthly price and charts RegencyCeramics Strong monthly Stock price targets for RegencyCeramics REGENCERAM are 44.07 and 59.06 | Monthly Target 1 | 32.72 | | Monthly Target 2 | 40.42 | | Monthly Target 3 | 47.706666666667 | | Monthly Target 4 | 55.41 | | Monthly Target 5 | 62.7 |
Monthly price and volumes Regency Ceramics
| Date |
Closing |
Open |
Range |
Volume |
Wed 29 October 2025 |
48.13 (14.62%) |
40.94 |
40.00 - 54.99 |
2.4287 times |
Tue 30 September 2025 |
41.99 (-12.28%) |
48.00 |
40.00 - 49.88 |
2.7412 times |
Fri 29 August 2025 |
47.87 (-4.77%) |
51.27 |
45.50 - 53.00 |
0.3915 times |
Thu 31 July 2025 |
50.27 (-5.61%) |
39.01 |
39.01 - 53.99 |
0.9462 times |
Thu 12 June 2025 |
53.26 (33.85%) |
41.68 |
39.00 - 57.69 |
2.1557 times |
Fri 30 May 2025 |
39.79 (-3.4%) |
43.22 |
37.45 - 45.69 |
0.6476 times |
Wed 30 April 2025 |
41.19 (-8.34%) |
47.15 |
39.49 - 48.50 |
0.3561 times |
Fri 28 March 2025 |
44.94 (1505%) |
26.00 |
25.20 - 50.55 |
0.3002 times |
Fri 19 October 2018 |
2.80 (-6.67%) |
2.80 |
2.80 - 2.80 |
0 times |
Fri 08 June 2018 |
3.00 (-14.29%) |
3.45 |
3.00 - 3.45 |
0.0328 times |
Thu 31 May 2018 |
3.50 (-25.53%) |
4.70 |
3.00 - 4.70 |
0.227 times |
DMA SMA EMA moving averages of Regency Ceramics REGENCERAM
DMA (daily moving average) of Regency Ceramics REGENCERAM
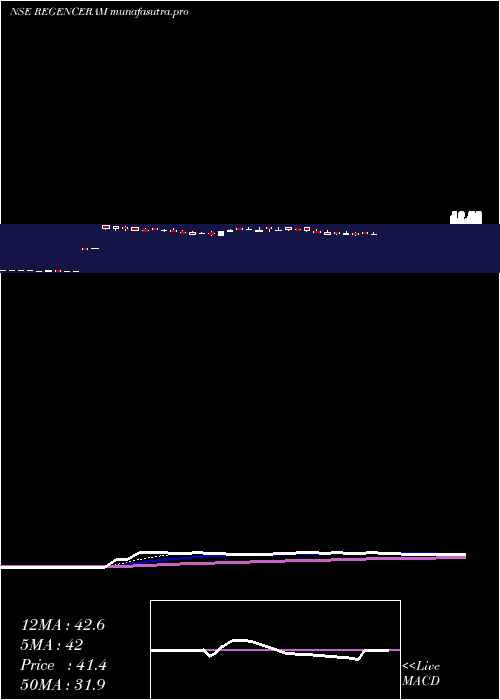
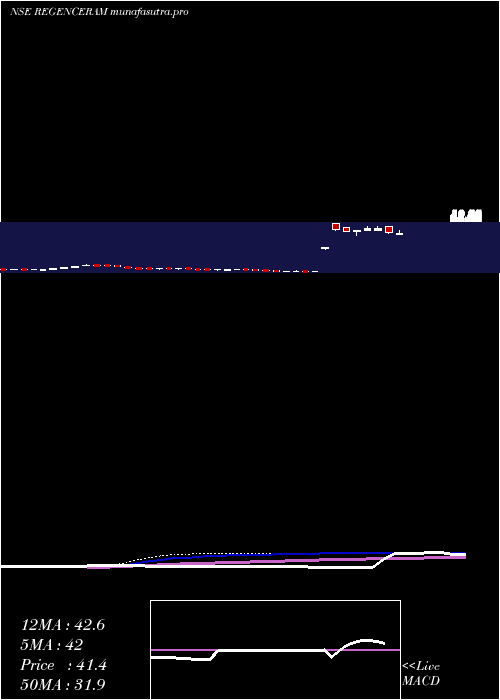
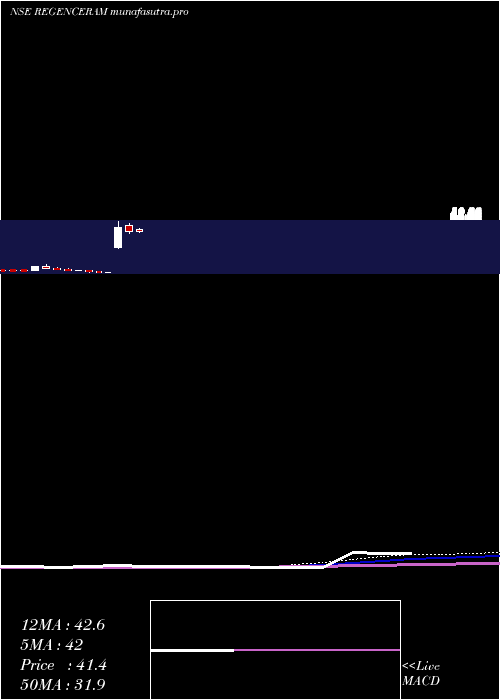
| DMA period | DMA value | | 5 day DMA | 48.34 | | 12 day DMA | 46.93 | | 20 day DMA | 44.83 | | 35 day DMA | 44.51 | | 50 day DMA | 45.42 | | 100 day DMA | 45.5 | | 150 day DMA | 39.39 | | 200 day DMA | 30.76 | EMA (exponential moving average) of Regency Ceramics REGENCERAM
| EMA period | EMA current | EMA prev | EMA prev2 | | 5 day EMA | 47.66 | 47.42 | 47.78 | | 12 day EMA | 46.66 | 46.39 | 46.34 | | 20 day EMA | 45.9 | 45.66 | 45.55 | | 35 day EMA | 45.82 | 45.68 | 45.62 | | 50 day EMA | 45.96 | 45.87 | 45.84 |
SMA (simple moving average) of Regency Ceramics REGENCERAM
| SMA period | SMA current | SMA prev | SMA prev2 | | 5 day SMA | 48.34 | 48.03 | 47.7 | | 12 day SMA | 46.93 | 46.45 | 46.05 | | 20 day SMA | 44.83 | 44.57 | 44.28 | | 35 day SMA | 44.51 | 44.5 | 44.51 | | 50 day SMA | 45.42 | 45.44 | 45.45 | | 100 day SMA | 45.5 | 45.44 | 45.39 | | 150 day SMA | 39.39 | 39.1 | 38.81 | | 200 day SMA | 30.76 | 30.55 | 30.34 |
|
|
