RefractoryShapes REFRACTORY_ST full analysis,charts,indicators,moving averages,SMA,DMA,EMA,ADX,MACD,RSIRefractory Shapes REFRACTORY_ST WideScreen charts, DMA,SMA,EMA technical analysis, forecast prediction, by indicators ADX,MACD,RSI,CCI NSE stock exchange
Daily price and charts and targets RefractoryShapes Strong Daily Stock price targets for RefractoryShapes REFRACTORY_ST are 58.9 and 59.1 | Daily Target 1 | 58.73 | | Daily Target 2 | 58.87 | | Daily Target 3 | 58.933333333333 | | Daily Target 4 | 59.07 | | Daily Target 5 | 59.13 |
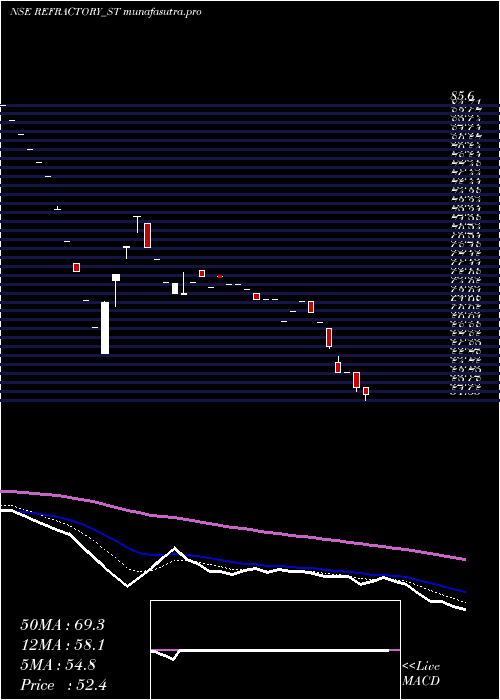
Daily price and volume Refractory Shapes
| Date |
Closing |
Open |
Range |
Volume |
Mon 14 July 2025 |
59.00 (-1.67%) |
58.80 |
58.80 - 59.00 |
0.8571 times |
Fri 11 July 2025 |
60.00 (-1.56%) |
59.80 |
59.75 - 60.00 |
0.8571 times |
Thu 10 July 2025 |
60.95 (1.92%) |
60.95 |
60.95 - 60.95 |
0.5714 times |
Wed 09 July 2025 |
59.80 (-1.97%) |
59.80 |
59.80 - 59.80 |
3.1429 times |
Tue 08 July 2025 |
61.00 (-1.61%) |
61.00 |
61.00 - 61.00 |
0.2857 times |
Mon 07 July 2025 |
62.00 (-1.98%) |
62.00 |
62.00 - 62.00 |
1.4286 times |
Fri 04 July 2025 |
63.25 (-1.94%) |
63.25 |
63.25 - 63.25 |
0.2857 times |
Thu 03 July 2025 |
64.50 (-0.08%) |
64.50 |
64.50 - 64.50 |
0.2857 times |
Wed 02 July 2025 |
64.55 (-1.97%) |
64.65 |
64.55 - 64.65 |
0.5714 times |
Tue 01 July 2025 |
65.85 (-1.57%) |
68.90 |
64.60 - 68.90 |
1.7143 times |
Mon 30 June 2025 |
66.90 (4.94%) |
66.80 |
65.00 - 66.90 |
5.7143 times |
Weekly price and charts RefractoryShapes Strong weekly Stock price targets for RefractoryShapes REFRACTORY_ST are 58.9 and 59.1 | Weekly Target 1 | 58.73 | | Weekly Target 2 | 58.87 | | Weekly Target 3 | 58.933333333333 | | Weekly Target 4 | 59.07 | | Weekly Target 5 | 59.13 |
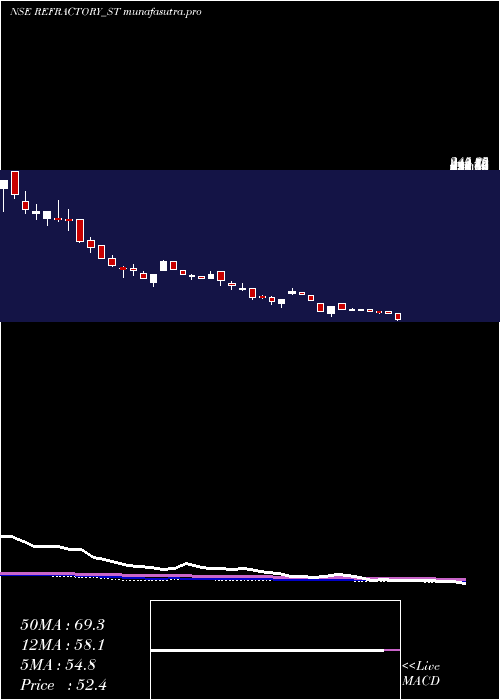
Weekly price and volumes for Refractory Shapes
| Date |
Closing |
Open |
Range |
Volume |
Mon 14 July 2025 |
59.00 (-1.67%) |
58.80 |
58.80 - 59.00 |
0.102 times |
Fri 11 July 2025 |
60.00 (-5.14%) |
62.00 |
59.75 - 62.00 |
0.7483 times |
Fri 04 July 2025 |
63.25 (-0.78%) |
66.80 |
63.25 - 68.90 |
1.0204 times |
Fri 27 June 2025 |
63.75 (22.6%) |
53.50 |
53.50 - 63.75 |
1.8707 times |
Fri 20 June 2025 |
52.00 (-6.81%) |
55.70 |
52.00 - 55.70 |
1.2245 times |
Fri 13 June 2025 |
55.80 (-7.15%) |
58.90 |
55.80 - 59.15 |
0.7823 times |
Fri 06 June 2025 |
60.10 (-5.21%) |
62.15 |
59.70 - 62.15 |
0.2381 times |
Fri 30 May 2025 |
63.40 (-9.23%) |
68.50 |
63.40 - 68.50 |
0.6463 times |
Fri 23 May 2025 |
69.85 (5.59%) |
67.45 |
67.45 - 72.50 |
1.4286 times |
Fri 16 May 2025 |
66.15 (26.24%) |
54.00 |
53.30 - 66.15 |
1.9388 times |
Fri 09 May 2025 |
52.40 (-13.6%) |
60.00 |
51.65 - 60.00 |
1.4286 times |
Monthly price and charts RefractoryShapes Strong monthly Stock price targets for RefractoryShapes REFRACTORY_ST are 53.85 and 63.95 | Monthly Target 1 | 52.13 | | Monthly Target 2 | 55.57 | | Monthly Target 3 | 62.233333333333 | | Monthly Target 4 | 65.67 | | Monthly Target 5 | 72.33 |
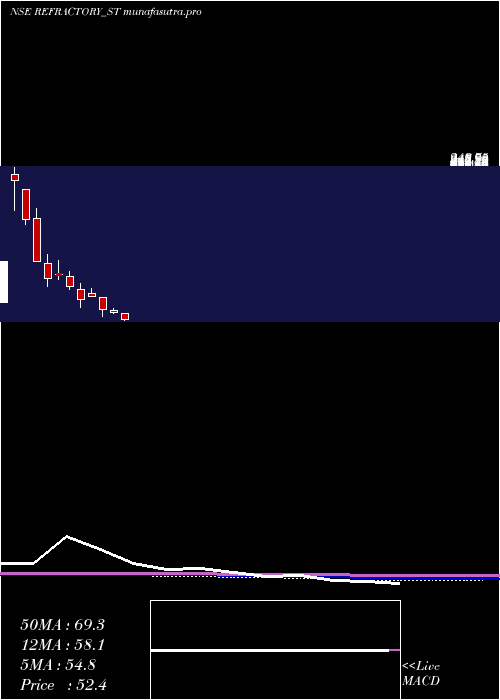
Monthly price and volumes Refractory Shapes
| Date |
Closing |
Open |
Range |
Volume |
Mon 14 July 2025 |
59.00 (-11.81%) |
68.90 |
58.80 - 68.90 |
0.1109 times |
Mon 30 June 2025 |
66.90 (5.52%) |
62.15 |
52.00 - 66.90 |
0.4468 times |
Fri 30 May 2025 |
63.40 (2.51%) |
60.65 |
51.65 - 72.50 |
0.5165 times |
Wed 30 April 2025 |
61.85 (-5.21%) |
63.95 |
60.80 - 66.60 |
0.1965 times |
Fri 28 March 2025 |
65.25 (-20.67%) |
80.60 |
57.05 - 80.60 |
2.1863 times |
Tue 25 February 2025 |
82.25 (4.38%) |
86.60 |
82.25 - 92.80 |
0.564 times |
Fri 31 January 2025 |
78.80 (-17.05%) |
92.05 |
68.60 - 99.40 |
1.3498 times |
Tue 31 December 2024 |
95.00 (-14.03%) |
108.30 |
91.85 - 115.00 |
1.6857 times |
Fri 29 November 2024 |
110.50 (4.64%) |
110.85 |
104.85 - 128.95 |
0.6242 times |
Thu 31 October 2024 |
105.60 (-17.72%) |
125.00 |
95.90 - 136.45 |
2.3194 times |
Mon 30 September 2024 |
128.35 (-29.71%) |
182.90 |
128.00 - 195.90 |
3.1812 times |
DMA SMA EMA moving averages of Refractory Shapes REFRACTORY_ST
DMA (daily moving average) of Refractory Shapes REFRACTORY_ST
| DMA period | DMA value | | 5 day DMA | 60.15 | | 12 day DMA | 62.63 | | 20 day DMA | 59.72 | | 35 day DMA | 60.31 | | 50 day DMA | 60.69 | | 100 day DMA | 66.34 | | 150 day DMA | 78.42 | | 200 day DMA | 94.33 | EMA (exponential moving average) of Refractory Shapes REFRACTORY_ST
| EMA period | EMA current | EMA prev | EMA prev2 | | 5 day EMA | 60.27 | 60.9 | 61.35 | | 12 day EMA | 60.82 | 61.15 | 61.36 | | 20 day EMA | 60.63 | 60.8 | 60.88 | | 35 day EMA | 60.72 | 60.82 | 60.87 | | 50 day EMA | 60.72 | 60.79 | 60.82 |
SMA (simple moving average) of Refractory Shapes REFRACTORY_ST
| SMA period | SMA current | SMA prev | SMA prev2 | | 5 day SMA | 60.15 | 60.75 | 61.4 | | 12 day SMA | 62.63 | 62.78 | 62.6 | | 20 day SMA | 59.72 | 59.55 | 59.34 | | 35 day SMA | 60.31 | 60.62 | 60.95 | | 50 day SMA | 60.69 | 60.72 | 60.76 | | 100 day SMA | 66.34 | 66.54 | 66.75 | | 150 day SMA | 78.42 | 78.85 | 79.27 | | 200 day SMA | 94.33 | 94.96 | 95.56 |
|
|
