RefractoryShapes REFRACTORY_SM full analysis,charts,indicators,moving averages,SMA,DMA,EMA,ADX,MACD,RSIRefractory Shapes REFRACTORY_SM WideScreen charts, DMA,SMA,EMA technical analysis, forecast prediction, by indicators ADX,MACD,RSI,CCI NSE stock exchange
Daily price and charts and targets RefractoryShapes Strong Daily Stock price targets for RefractoryShapes REFRACTORY_SM are 46.23 and 46.68 | Daily Target 1 | 45.85 | | Daily Target 2 | 46.15 | | Daily Target 3 | 46.3 | | Daily Target 4 | 46.6 | | Daily Target 5 | 46.75 |
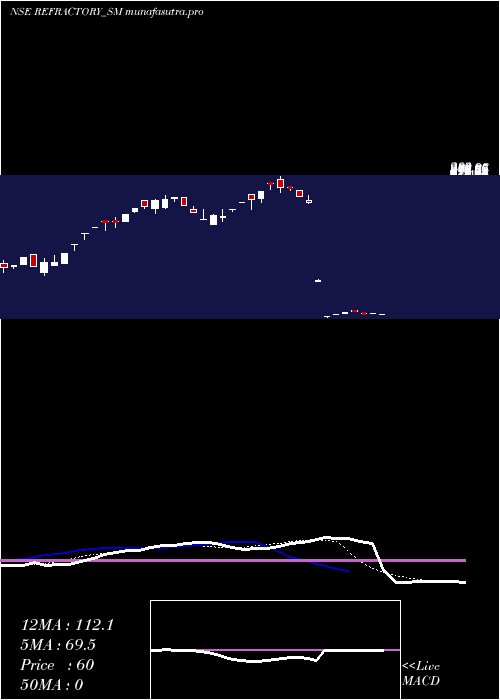
Daily price and volume Refractory Shapes
| Date |
Closing |
Open |
Range |
Volume |
Tue 28 October 2025 |
46.45 (4.97%) |
46.40 |
46.00 - 46.45 |
0.5109 times |
Mon 27 October 2025 |
44.25 (4.98%) |
44.20 |
40.55 - 44.25 |
1.0949 times |
Fri 24 October 2025 |
42.15 (4.98%) |
40.50 |
40.10 - 42.15 |
3.2847 times |
Thu 23 October 2025 |
40.15 (-4.97%) |
40.15 |
40.15 - 40.15 |
0.365 times |
Mon 20 October 2025 |
42.25 (3.3%) |
40.90 |
40.90 - 42.40 |
0.5109 times |
Fri 17 October 2025 |
40.90 (0.25%) |
40.90 |
40.90 - 40.90 |
0.073 times |
Thu 16 October 2025 |
40.80 (3.29%) |
39.95 |
39.95 - 40.80 |
0.5839 times |
Wed 15 October 2025 |
39.50 (-3.66%) |
41.00 |
39.20 - 41.50 |
0.7299 times |
Tue 14 October 2025 |
41.00 (-2.84%) |
40.45 |
40.10 - 41.90 |
1.6058 times |
Fri 10 October 2025 |
42.20 (4.98%) |
41.95 |
41.95 - 42.20 |
1.2409 times |
Thu 09 October 2025 |
40.20 (0%) |
39.05 |
39.00 - 42.20 |
2.7737 times |
Weekly price and charts RefractoryShapes Strong weekly Stock price targets for RefractoryShapes REFRACTORY_SM are 43.5 and 49.4 | Weekly Target 1 | 38.58 | | Weekly Target 2 | 42.52 | | Weekly Target 3 | 44.483333333333 | | Weekly Target 4 | 48.42 | | Weekly Target 5 | 50.38 |
Weekly price and volumes for Refractory Shapes
| Date |
Closing |
Open |
Range |
Volume |
Tue 28 October 2025 |
46.45 (10.2%) |
44.20 |
40.55 - 46.45 |
0.3333 times |
Fri 24 October 2025 |
42.15 (3.06%) |
40.90 |
40.10 - 42.40 |
0.8636 times |
Fri 17 October 2025 |
40.90 (-3.08%) |
40.45 |
39.20 - 41.90 |
0.6212 times |
Fri 10 October 2025 |
42.20 (-5.38%) |
42.65 |
39.00 - 45.75 |
2.1061 times |
Fri 03 October 2025 |
44.60 (-12.55%) |
49.65 |
43.20 - 49.65 |
1.7879 times |
Fri 26 September 2025 |
51.00 (-7.1%) |
54.90 |
49.15 - 54.90 |
1.4394 times |
Fri 19 September 2025 |
54.90 (-0.54%) |
57.90 |
52.25 - 57.95 |
0.4394 times |
Thu 11 September 2025 |
55.20 (-0.09%) |
57.00 |
55.15 - 60.90 |
0.5 times |
Fri 05 September 2025 |
55.25 (-14.21%) |
62.00 |
55.25 - 62.00 |
0.3788 times |
Fri 29 August 2025 |
64.40 (-43.76%) |
57.15 |
54.45 - 66.00 |
1.5303 times |
Tue 08 October 2024 |
114.50 (-54.49%) |
243.65 |
113.00 - 251.95 |
1.3939 times |

Monthly price and charts RefractoryShapes Strong monthly Stock price targets for RefractoryShapes REFRACTORY_SM are 42.73 and 50.18 | Monthly Target 1 | 36.52 | | Monthly Target 2 | 41.48 | | Monthly Target 3 | 43.966666666667 | | Monthly Target 4 | 48.93 | | Monthly Target 5 | 51.42 |
Monthly price and volumes Refractory Shapes
| Date |
Closing |
Open |
Range |
Volume |
Tue 28 October 2025 |
46.45 (0.87%) |
44.80 |
39.00 - 46.45 |
0.2137 times |
Tue 30 September 2025 |
46.05 (-28.49%) |
62.00 |
46.05 - 62.00 |
0.1767 times |
Fri 29 August 2025 |
64.40 (-43.76%) |
57.15 |
54.45 - 66.00 |
0.0705 times |
Tue 08 October 2024 |
114.50 (-52.4%) |
114.00 |
113.00 - 116.20 |
0.0391 times |
Mon 15 July 2024 |
240.55 (12.64%) |
206.00 |
206.00 - 283.00 |
1.0698 times |
Fri 28 June 2024 |
213.55 (54.19%) |
140.00 |
123.40 - 252.85 |
3.743 times |
Fri 31 May 2024 |
138.50 (0%) |
139.90 |
127.40 - 148.00 |
1.6872 times |
Tue 28 October 2025 |
(0%) |
|
- |
0 times |

DMA SMA EMA moving averages of Refractory Shapes REFRACTORY_SM
DMA (daily moving average) of Refractory Shapes REFRACTORY_SM
| DMA period | DMA value | | 5 day DMA | 43.05 | | 12 day DMA | 41.67 | | 20 day DMA | 43.63 | | 35 day DMA | 48.68 | | 50 day DMA | 84.49 | | 100 day DMA | | | 150 day DMA | | | 200 day DMA | | EMA (exponential moving average) of Refractory Shapes REFRACTORY_SM
| EMA period | EMA current | EMA prev | EMA prev2 | | 5 day EMA | 43.7 | 42.32 | 41.36 | | 12 day EMA | 43.42 | 42.87 | 42.62 | | 20 day EMA | 48.3 | 48.49 | 48.94 | | 35 day EMA | 69.96 | 71.34 | 72.94 | | 50 day EMA | 91.61 | 93.45 | 95.46 |
SMA (simple moving average) of Refractory Shapes REFRACTORY_SM
| SMA period | SMA current | SMA prev | SMA prev2 | | 5 day SMA | 43.05 | 41.94 | 41.25 | | 12 day SMA | 41.67 | 41.31 | 41.29 | | 20 day SMA | 43.63 | 43.88 | 44.29 | | 35 day SMA | 48.68 | 49.1 | 49.58 | | 50 day SMA | 84.49 | 88.16 | 91.66 | | 100 day SMA | | 150 day SMA | | 200 day SMA |
|
|
