RedingtonIndia REDINGTON full analysis,charts,indicators,moving averages,SMA,DMA,EMA,ADX,MACD,RSIRedington India REDINGTON WideScreen charts, DMA,SMA,EMA technical analysis, forecast prediction, by indicators ADX,MACD,RSI,CCI NSE stock exchange
operates under Comm.Trading & Distribution sector
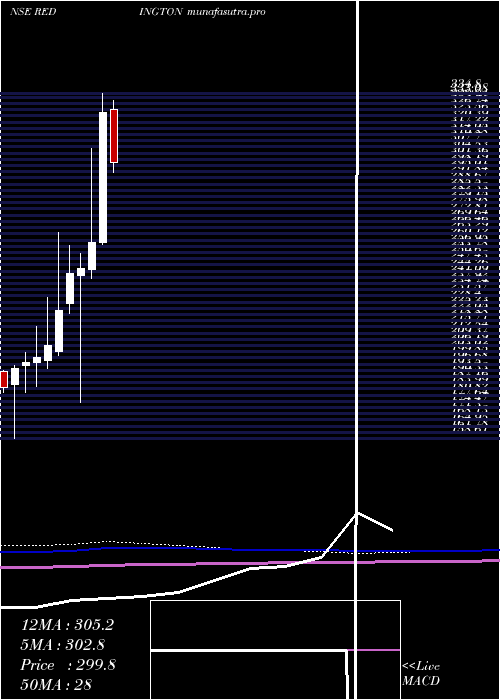
Daily price and charts and targets RedingtonIndia Strong Daily Stock price targets for RedingtonIndia REDINGTON are 258.98 and 263.98 | Daily Target 1 | 257.98 | | Daily Target 2 | 259.97 | | Daily Target 3 | 262.98333333333 | | Daily Target 4 | 264.97 | | Daily Target 5 | 267.98 |
Daily price and volume Redington India
| Date |
Closing |
Open |
Range |
Volume |
Mon 27 October 2025 |
261.95 (-0.8%) |
265.10 |
261.00 - 266.00 |
0.6497 times |
Fri 24 October 2025 |
264.05 (-0.51%) |
265.80 |
262.90 - 269.85 |
0.8848 times |
Thu 23 October 2025 |
265.40 (-1.15%) |
269.00 |
264.95 - 271.20 |
1.0512 times |
Tue 21 October 2025 |
268.50 (0.49%) |
270.40 |
267.15 - 272.00 |
0.217 times |
Mon 20 October 2025 |
267.20 (-0.63%) |
268.65 |
263.45 - 270.00 |
0.8 times |
Fri 17 October 2025 |
268.90 (-1.03%) |
272.45 |
267.10 - 274.35 |
0.8276 times |
Thu 16 October 2025 |
271.70 (-1.77%) |
276.00 |
270.80 - 276.50 |
0.7347 times |
Wed 15 October 2025 |
276.60 (1.32%) |
274.50 |
272.95 - 278.95 |
1.1466 times |
Tue 14 October 2025 |
273.00 (-2.29%) |
279.30 |
268.55 - 279.85 |
1.3626 times |
Mon 13 October 2025 |
279.40 (-3.69%) |
286.00 |
278.00 - 286.95 |
2.3258 times |
Fri 10 October 2025 |
290.10 (8%) |
269.70 |
267.70 - 293.80 |
18.2896 times |
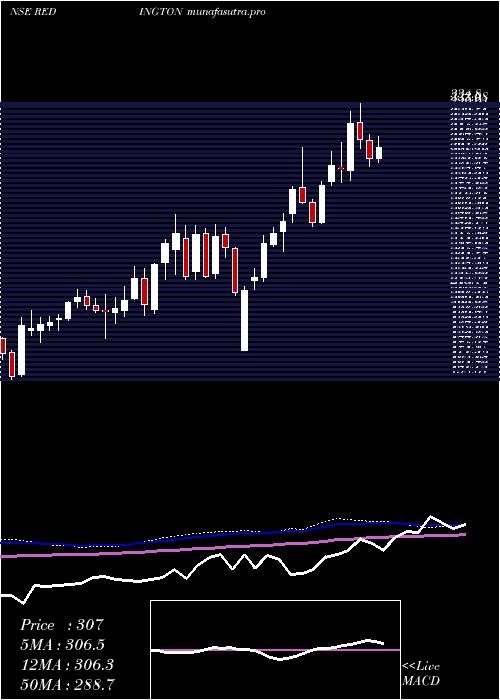
Weekly price and charts RedingtonIndia Strong weekly Stock price targets for RedingtonIndia REDINGTON are 258.98 and 263.98 | Weekly Target 1 | 257.98 | | Weekly Target 2 | 259.97 | | Weekly Target 3 | 262.98333333333 | | Weekly Target 4 | 264.97 | | Weekly Target 5 | 267.98 |
Weekly price and volumes for Redington India
| Date |
Closing |
Open |
Range |
Volume |
Mon 27 October 2025 |
261.95 (-0.8%) |
265.10 |
261.00 - 266.00 |
0.0326 times |
Fri 24 October 2025 |
264.05 (-1.8%) |
268.65 |
262.90 - 272.00 |
0.1483 times |
Fri 17 October 2025 |
268.90 (-7.31%) |
286.00 |
267.10 - 286.95 |
0.3214 times |
Fri 10 October 2025 |
290.10 (3.66%) |
280.90 |
266.70 - 293.80 |
1.0797 times |
Fri 03 October 2025 |
279.85 (5.67%) |
268.75 |
262.55 - 299.89 |
0.9798 times |
Fri 26 September 2025 |
264.83 (-11.64%) |
299.50 |
260.00 - 302.22 |
0.5789 times |
Fri 19 September 2025 |
299.73 (22.94%) |
243.80 |
241.00 - 314.40 |
6.3304 times |
Fri 12 September 2025 |
243.80 (2.95%) |
237.99 |
237.02 - 249.20 |
0.1602 times |
Fri 05 September 2025 |
236.81 (-1.68%) |
240.60 |
235.64 - 246.80 |
0.199 times |
Fri 29 August 2025 |
240.85 (-1.01%) |
244.00 |
229.80 - 245.50 |
0.1697 times |
Fri 22 August 2025 |
243.30 (2.61%) |
240.00 |
235.35 - 249.15 |
0.2607 times |
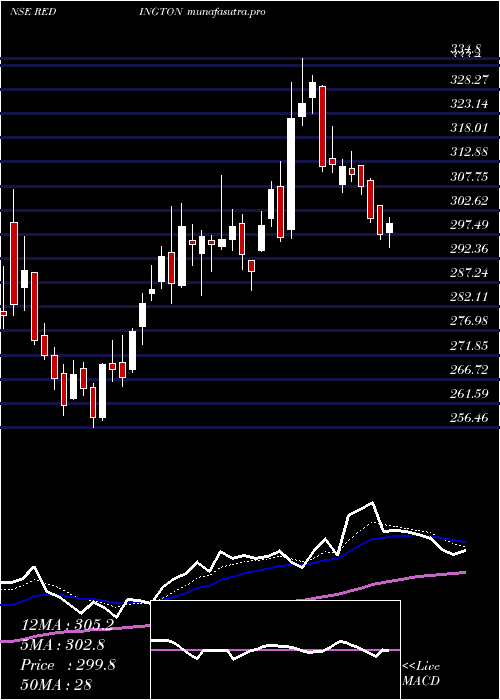
Monthly price and charts RedingtonIndia Strong monthly Stock price targets for RedingtonIndia REDINGTON are 245.08 and 277.88 | Monthly Target 1 | 239.45 | | Monthly Target 2 | 250.7 | | Monthly Target 3 | 272.25 | | Monthly Target 4 | 283.5 | | Monthly Target 5 | 305.05 |
Monthly price and volumes Redington India
| Date |
Closing |
Open |
Range |
Volume |
Mon 27 October 2025 |
261.95 (-7.58%) |
285.00 |
261.00 - 293.80 |
0.5819 times |
Tue 30 September 2025 |
283.43 (17.68%) |
240.60 |
235.64 - 314.40 |
2.6941 times |
Fri 29 August 2025 |
240.85 (-3.74%) |
251.50 |
229.80 - 258.85 |
0.3303 times |
Thu 31 July 2025 |
250.20 (-23.1%) |
326.60 |
248.05 - 331.25 |
0.4039 times |
Mon 30 June 2025 |
325.35 (25.78%) |
258.60 |
258.00 - 334.80 |
0.6694 times |
Fri 30 May 2025 |
258.67 (5.27%) |
245.20 |
240.55 - 306.99 |
0.866 times |
Wed 30 April 2025 |
245.71 (1.14%) |
241.95 |
176.94 - 253.17 |
0.791 times |
Fri 28 March 2025 |
242.95 (8.31%) |
227.61 |
222.56 - 257.50 |
1.0471 times |
Fri 28 February 2025 |
224.32 (8.77%) |
203.20 |
200.81 - 263.89 |
1.6753 times |
Fri 31 January 2025 |
206.23 (3.08%) |
198.70 |
194.23 - 230.90 |
0.941 times |
Tue 31 December 2024 |
200.07 (1.23%) |
197.60 |
185.00 - 215.90 |
0.49 times |
DMA SMA EMA moving averages of Redington India REDINGTON
DMA (daily moving average) of Redington India REDINGTON
| DMA period | DMA value | | 5 day DMA | 265.42 | | 12 day DMA | 271.28 | | 20 day DMA | 273.98 | | 35 day DMA | 270.33 | | 50 day DMA | 261.43 | | 100 day DMA | 275.76 | | 150 day DMA | 266.38 | | 200 day DMA | 256.17 | EMA (exponential moving average) of Redington India REDINGTON
| EMA period | EMA current | EMA prev | EMA prev2 | | 5 day EMA | 265.4 | 267.12 | 268.65 | | 12 day EMA | 269.27 | 270.6 | 271.79 | | 20 day EMA | 270.17 | 271.04 | 271.77 | | 35 day EMA | 265.57 | 265.78 | 265.88 | | 50 day EMA | 260.08 | 260 | 259.83 |
SMA (simple moving average) of Redington India REDINGTON
| SMA period | SMA current | SMA prev | SMA prev2 | | 5 day SMA | 265.42 | 266.81 | 268.34 | | 12 day SMA | 271.28 | 272.3 | 273.19 | | 20 day SMA | 273.98 | 274.32 | 274.82 | | 35 day SMA | 270.33 | 269.77 | 269.01 | | 50 day SMA | 261.43 | 260.91 | 260.48 | | 100 day SMA | 275.76 | 275.83 | 275.89 | | 150 day SMA | 266.38 | 266.15 | 265.89 | | 200 day SMA | 256.17 | 255.87 | 255.56 |
|
|
