RashtriyaChemicals RCF full analysis,charts,indicators,moving averages,SMA,DMA,EMA,ADX,MACD,RSIRashtriya Chemicals RCF WideScreen charts, DMA,SMA,EMA technical analysis, forecast prediction, by indicators ADX,MACD,RSI,CCI NSE stock exchange
operates under Fertilizers sector
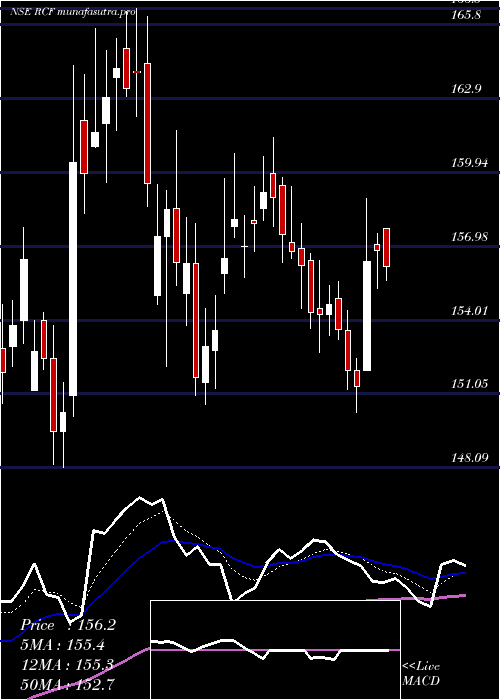
Daily price and charts and targets RashtriyaChemicals Strong Daily Stock price targets for RashtriyaChemicals RCF are 148.89 and 153.96 | Daily Target 1 | 145.05 | | Daily Target 2 | 147.65 | | Daily Target 3 | 150.12 | | Daily Target 4 | 152.72 | | Daily Target 5 | 155.19 |
Daily price and volume Rashtriya Chemicals
| Date |
Closing |
Open |
Range |
Volume |
Tue 28 October 2025 |
150.25 (1.71%) |
147.80 |
147.52 - 152.59 |
2.4343 times |
Mon 27 October 2025 |
147.72 (-0.09%) |
149.00 |
147.32 - 149.00 |
0.3745 times |
Fri 24 October 2025 |
147.86 (-0.4%) |
148.01 |
147.27 - 148.99 |
0.4594 times |
Thu 23 October 2025 |
148.45 (-0.43%) |
149.68 |
148.04 - 149.73 |
0.3522 times |
Tue 21 October 2025 |
149.09 (0.74%) |
148.69 |
148.52 - 149.99 |
0.1622 times |
Mon 20 October 2025 |
147.99 (-0.71%) |
149.05 |
146.99 - 149.37 |
0.4738 times |
Fri 17 October 2025 |
149.05 (-1.97%) |
151.61 |
148.51 - 151.61 |
0.664 times |
Thu 16 October 2025 |
152.05 (3.51%) |
148.00 |
147.16 - 153.95 |
3.823 times |
Wed 15 October 2025 |
146.89 (1.99%) |
144.70 |
143.55 - 148.22 |
0.5992 times |
Tue 14 October 2025 |
144.03 (-1.15%) |
146.00 |
143.10 - 146.60 |
0.6574 times |
Mon 13 October 2025 |
145.71 (-0.64%) |
146.41 |
144.75 - 146.48 |
0.5447 times |
Weekly price and charts RashtriyaChemicals Strong weekly Stock price targets for RashtriyaChemicals RCF are 148.79 and 154.06 | Weekly Target 1 | 144.78 | | Weekly Target 2 | 147.52 | | Weekly Target 3 | 150.05333333333 | | Weekly Target 4 | 152.79 | | Weekly Target 5 | 155.32 |
Weekly price and volumes for Rashtriya Chemicals
| Date |
Closing |
Open |
Range |
Volume |
Tue 28 October 2025 |
150.25 (1.62%) |
149.00 |
147.32 - 152.59 |
0.5688 times |
Fri 24 October 2025 |
147.86 (-0.8%) |
149.05 |
146.99 - 149.99 |
0.2931 times |
Fri 17 October 2025 |
149.05 (1.64%) |
146.41 |
143.10 - 153.95 |
1.2734 times |
Fri 10 October 2025 |
146.65 (-1.66%) |
149.90 |
145.80 - 150.32 |
0.5318 times |
Fri 03 October 2025 |
149.12 (3.74%) |
145.00 |
143.25 - 149.87 |
0.6354 times |
Fri 26 September 2025 |
143.75 (-6.67%) |
153.72 |
143.30 - 154.39 |
0.8499 times |
Fri 19 September 2025 |
154.03 (1.2%) |
153.00 |
152.60 - 157.90 |
1.0305 times |
Fri 12 September 2025 |
152.20 (-3.3%) |
157.40 |
151.23 - 158.14 |
1.0276 times |
Fri 05 September 2025 |
157.40 (5.69%) |
149.30 |
149.30 - 164.49 |
2.7292 times |
Fri 29 August 2025 |
148.93 (-6.27%) |
160.20 |
148.30 - 162.40 |
1.0603 times |
Fri 22 August 2025 |
158.90 (9.48%) |
147.00 |
144.98 - 161.35 |
3.5131 times |
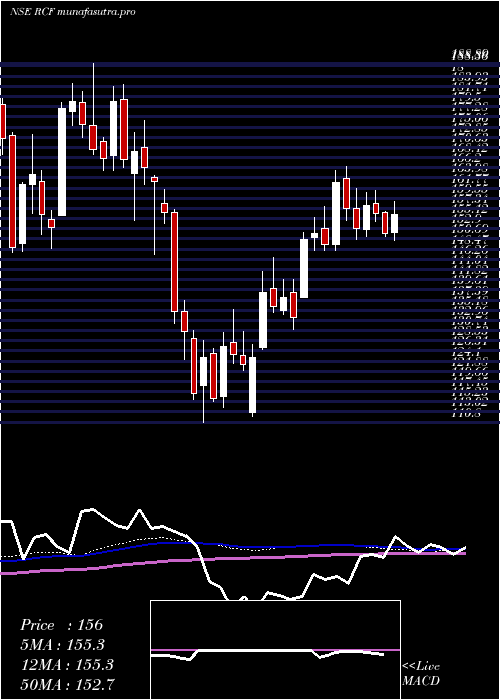
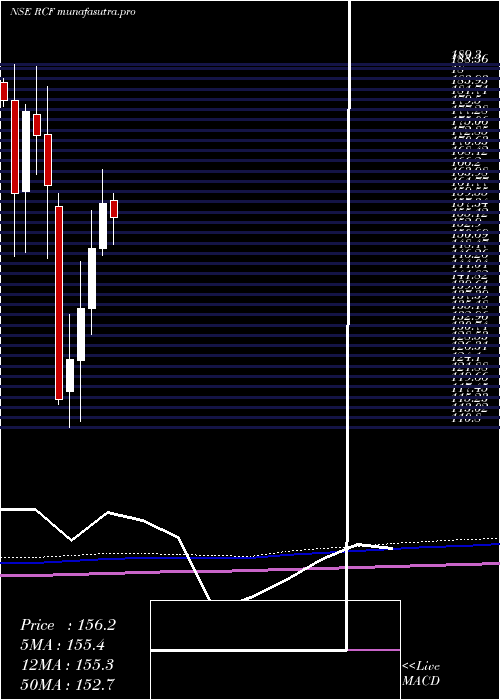
Monthly price and charts RashtriyaChemicals Strong monthly Stock price targets for RashtriyaChemicals RCF are 146.68 and 157.53 | Monthly Target 1 | 138.25 | | Monthly Target 2 | 144.25 | | Monthly Target 3 | 149.1 | | Monthly Target 4 | 155.1 | | Monthly Target 5 | 159.95 |
Monthly price and volumes Rashtriya Chemicals
| Date |
Closing |
Open |
Range |
Volume |
Tue 28 October 2025 |
150.25 (3.04%) |
146.00 |
143.10 - 153.95 |
0.3617 times |
Tue 30 September 2025 |
145.82 (-2.09%) |
149.30 |
143.25 - 164.49 |
0.705 times |
Fri 29 August 2025 |
148.93 (-2.26%) |
152.44 |
141.65 - 162.40 |
0.8576 times |
Thu 31 July 2025 |
152.37 (-4.25%) |
159.89 |
148.20 - 161.35 |
0.6375 times |
Mon 30 June 2025 |
159.13 (6.4%) |
149.56 |
148.09 - 166.50 |
1.7899 times |
Fri 30 May 2025 |
149.56 (9.6%) |
136.53 |
131.00 - 157.74 |
1.448 times |
Wed 30 April 2025 |
136.46 (8.72%) |
125.29 |
112.10 - 146.75 |
1.1607 times |
Fri 28 March 2025 |
125.52 (7.26%) |
118.69 |
110.80 - 135.38 |
0.8884 times |
Fri 28 February 2025 |
117.02 (-28.29%) |
158.51 |
115.75 - 161.49 |
0.7049 times |
Fri 31 January 2025 |
163.19 (-6.1%) |
174.20 |
147.35 - 184.40 |
1.4463 times |
Tue 31 December 2024 |
173.80 (-2.93%) |
178.50 |
165.50 - 188.89 |
1.4326 times |
DMA SMA EMA moving averages of Rashtriya Chemicals RCF
DMA (daily moving average) of Rashtriya Chemicals RCF
| DMA period | DMA value | | 5 day DMA | 148.67 | | 12 day DMA | 147.98 | | 20 day DMA | 147.69 | | 35 day DMA | 149.58 | | 50 day DMA | 150.94 | | 100 day DMA | 152.89 | | 150 day DMA | 148.25 | | 200 day DMA | 147.27 | EMA (exponential moving average) of Rashtriya Chemicals RCF
| EMA period | EMA current | EMA prev | EMA prev2 | | 5 day EMA | 148.82 | 148.11 | 148.3 | | 12 day EMA | 148.44 | 148.11 | 148.18 | | 20 day EMA | 148.58 | 148.4 | 148.47 | | 35 day EMA | 149.27 | 149.21 | 149.3 | | 50 day EMA | 150.35 | 150.35 | 150.46 |
SMA (simple moving average) of Rashtriya Chemicals RCF
| SMA period | SMA current | SMA prev | SMA prev2 | | 5 day SMA | 148.67 | 148.22 | 148.49 | | 12 day SMA | 147.98 | 147.67 | 147.66 | | 20 day SMA | 147.69 | 147.36 | 147.41 | | 35 day SMA | 149.58 | 149.79 | 150.16 | | 50 day SMA | 150.94 | 150.89 | 150.85 | | 100 day SMA | 152.89 | 152.99 | 153.11 | | 150 day SMA | 148.25 | 148.06 | 147.86 | | 200 day SMA | 147.27 | 147.36 | 147.53 |
|
|
