RamdevbabaSolvent RBS_SM full analysis,charts,indicators,moving averages,SMA,DMA,EMA,ADX,MACD,RSIRamdevbaba Solvent RBS_SM WideScreen charts, DMA,SMA,EMA technical analysis, forecast prediction, by indicators ADX,MACD,RSI,CCI NSE stock exchange
Daily price and charts and targets RamdevbabaSolvent Strong Daily Stock price targets for RamdevbabaSolvent RBS_SM are 117.7 and 121.45 | Daily Target 1 | 114.72 | | Daily Target 2 | 116.93 | | Daily Target 3 | 118.46666666667 | | Daily Target 4 | 120.68 | | Daily Target 5 | 122.22 |
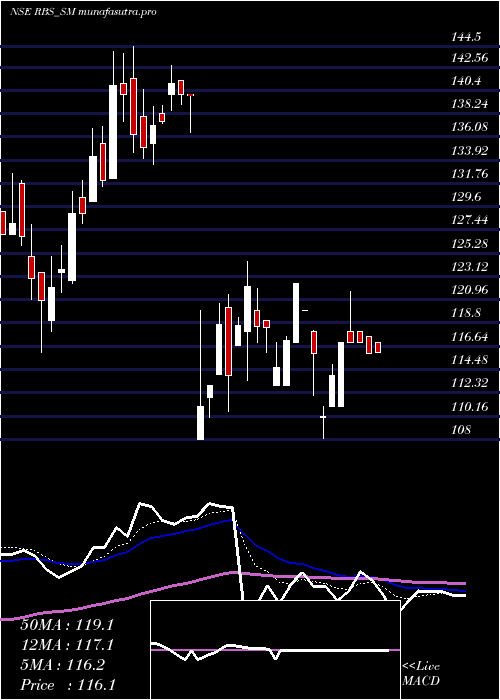
Daily price and volume Ramdevbaba Solvent
| Date |
Closing |
Open |
Range |
Volume |
Wed 29 October 2025 |
119.15 (2.72%) |
116.25 |
116.25 - 120.00 |
0.916 times |
Tue 28 October 2025 |
116.00 (-3.41%) |
120.00 |
114.00 - 120.00 |
1.5267 times |
Mon 27 October 2025 |
120.10 (3.09%) |
118.00 |
118.00 - 120.20 |
0.6107 times |
Fri 24 October 2025 |
116.50 (0.26%) |
116.50 |
113.10 - 117.25 |
1.145 times |
Thu 23 October 2025 |
116.20 (-2.64%) |
118.00 |
114.05 - 118.00 |
0.8397 times |
Tue 21 October 2025 |
119.35 (2.01%) |
117.05 |
117.00 - 123.00 |
0.8397 times |
Mon 20 October 2025 |
117.00 (4.51%) |
113.25 |
113.25 - 118.00 |
0.916 times |
Fri 17 October 2025 |
111.95 (-2.18%) |
114.05 |
108.80 - 115.75 |
1.6794 times |
Thu 16 October 2025 |
114.45 (0.04%) |
114.45 |
114.45 - 114.45 |
0.0763 times |
Wed 15 October 2025 |
114.40 (-1.59%) |
117.00 |
114.40 - 118.00 |
1.4504 times |
Tue 14 October 2025 |
116.25 (-2.39%) |
118.55 |
116.25 - 120.00 |
0.687 times |
Weekly price and charts RamdevbabaSolvent Strong weekly Stock price targets for RamdevbabaSolvent RBS_SM are 116.58 and 122.78 | Weekly Target 1 | 111.58 | | Weekly Target 2 | 115.37 | | Weekly Target 3 | 117.78333333333 | | Weekly Target 4 | 121.57 | | Weekly Target 5 | 123.98 |
Weekly price and volumes for Ramdevbaba Solvent
| Date |
Closing |
Open |
Range |
Volume |
Wed 29 October 2025 |
119.15 (2.27%) |
118.00 |
114.00 - 120.20 |
0.7092 times |
Fri 24 October 2025 |
116.50 (4.06%) |
113.25 |
113.10 - 123.00 |
0.8688 times |
Fri 17 October 2025 |
111.95 (-7.25%) |
119.90 |
108.80 - 120.00 |
0.9574 times |
Fri 10 October 2025 |
120.70 (-5%) |
126.50 |
120.65 - 126.50 |
0.656 times |
Fri 03 October 2025 |
127.05 (4.18%) |
122.25 |
120.80 - 127.20 |
1.117 times |
Fri 26 September 2025 |
121.95 (-3.21%) |
126.50 |
119.75 - 132.00 |
1.2589 times |
Fri 19 September 2025 |
126.00 (-1.79%) |
129.40 |
126.00 - 129.50 |
1.3475 times |
Fri 12 September 2025 |
128.30 (5.16%) |
123.25 |
123.25 - 134.00 |
1.3652 times |
Fri 05 September 2025 |
122.00 (3.21%) |
118.20 |
116.00 - 123.25 |
0.9397 times |
Fri 29 August 2025 |
118.20 (-9.77%) |
129.00 |
116.50 - 130.50 |
0.7801 times |
Fri 22 August 2025 |
131.00 (-0.76%) |
134.50 |
129.00 - 134.50 |
1.0993 times |

Monthly price and charts RamdevbabaSolvent Strong monthly Stock price targets for RamdevbabaSolvent RBS_SM are 104.78 and 123.18 | Monthly Target 1 | 99.98 | | Monthly Target 2 | 109.57 | | Monthly Target 3 | 118.38333333333 | | Monthly Target 4 | 127.97 | | Monthly Target 5 | 136.78 |
Monthly price and volumes Ramdevbaba Solvent
| Date |
Closing |
Open |
Range |
Volume |
Wed 29 October 2025 |
119.15 (-2.58%) |
121.00 |
108.80 - 127.20 |
0.4768 times |
Tue 30 September 2025 |
122.30 (3.47%) |
118.20 |
116.00 - 134.00 |
0.6818 times |
Fri 29 August 2025 |
118.20 (-11.23%) |
132.00 |
116.50 - 137.95 |
1.6979 times |
Thu 31 July 2025 |
133.15 (18.51%) |
113.45 |
112.10 - 143.00 |
1.6778 times |
Mon 30 June 2025 |
112.35 (5.99%) |
107.80 |
105.00 - 116.55 |
0.6996 times |
Fri 30 May 2025 |
106.00 (4.64%) |
103.90 |
99.10 - 112.50 |
0.7442 times |
Wed 30 April 2025 |
101.30 (-11.64%) |
113.00 |
101.00 - 122.45 |
0.5125 times |
Fri 28 March 2025 |
114.65 (-18.08%) |
108.00 |
108.00 - 124.50 |
0.6618 times |
Mon 09 December 2024 |
139.95 (2.68%) |
138.00 |
133.55 - 142.70 |
0.3699 times |
Fri 29 November 2024 |
136.30 (3.77%) |
134.00 |
116.10 - 144.50 |
2.4777 times |
Thu 31 October 2024 |
131.35 (39.73%) |
95.00 |
91.50 - 134.90 |
5.0646 times |

DMA SMA EMA moving averages of Ramdevbaba Solvent RBS_SM
DMA (daily moving average) of Ramdevbaba Solvent RBS_SM
| DMA period | DMA value | | 5 day DMA | 117.59 | | 12 day DMA | 116.7 | | 20 day DMA | 119.65 | | 35 day DMA | 122.53 | | 50 day DMA | 123.63 | | 100 day DMA | 123.65 | | 150 day DMA | 119.09 | | 200 day DMA | 119.34 | EMA (exponential moving average) of Ramdevbaba Solvent RBS_SM
| EMA period | EMA current | EMA prev | EMA prev2 | | 5 day EMA | 117.85 | 117.2 | 117.8 | | 12 day EMA | 118.13 | 117.95 | 118.31 | | 20 day EMA | 119.39 | 119.41 | 119.77 | | 35 day EMA | 121.52 | 121.66 | 121.99 | | 50 day EMA | 123.87 | 124.06 | 124.39 |
SMA (simple moving average) of Ramdevbaba Solvent RBS_SM
| SMA period | SMA current | SMA prev | SMA prev2 | | 5 day SMA | 117.59 | 117.63 | 117.83 | | 12 day SMA | 116.7 | 116.83 | 117.42 | | 20 day SMA | 119.65 | 119.87 | 120.17 | | 35 day SMA | 122.53 | 122.75 | 122.92 | | 50 day SMA | 123.63 | 123.89 | 124.26 | | 100 day SMA | 123.65 | 123.52 | 123.41 | | 150 day SMA | 119.09 | 119.05 | 119.02 | | 200 day SMA | 119.34 | 119.2 | 119.09 |
|
|
