RbmInfracon RBMINFRA_ST full analysis,charts,indicators,moving averages,SMA,DMA,EMA,ADX,MACD,RSIRbm Infracon RBMINFRA_ST WideScreen charts, DMA,SMA,EMA technical analysis, forecast prediction, by indicators ADX,MACD,RSI,CCI NSE stock exchange
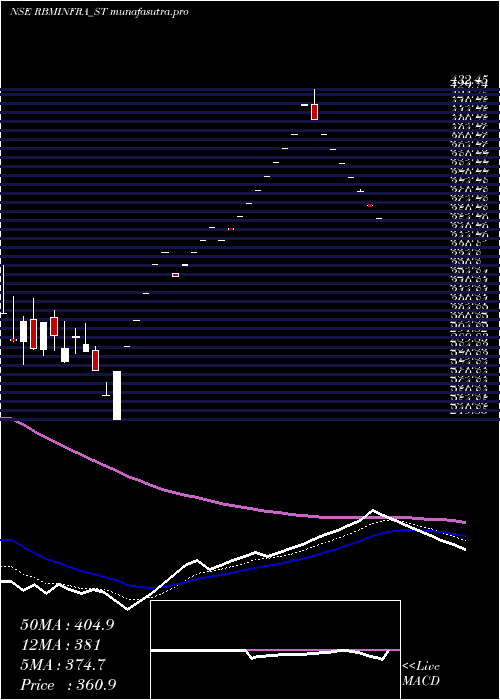
Daily price and charts and targets RbmInfracon Strong Daily Stock price targets for RbmInfracon RBMINFRA_ST are 416.4 and 433.15 | Daily Target 1 | 413.03 | | Daily Target 2 | 419.77 | | Daily Target 3 | 429.78333333333 | | Daily Target 4 | 436.52 | | Daily Target 5 | 446.53 |
Daily price and volume Rbm Infracon
| Date |
Closing |
Open |
Range |
Volume |
Fri 11 July 2025 |
426.50 (-3.84%) |
435.70 |
423.05 - 439.80 |
3.249 times |
Thu 10 July 2025 |
443.55 (-2.51%) |
454.00 |
435.00 - 454.00 |
0.7996 times |
Wed 09 July 2025 |
454.95 (-0.09%) |
457.95 |
454.00 - 464.60 |
0.6579 times |
Tue 08 July 2025 |
455.35 (-2.88%) |
460.00 |
450.00 - 462.20 |
1.2045 times |
Mon 07 July 2025 |
468.85 (-2.29%) |
480.00 |
456.10 - 480.00 |
1.4474 times |
Fri 04 July 2025 |
479.85 (-0.02%) |
479.95 |
479.85 - 482.95 |
0.5769 times |
Thu 03 July 2025 |
479.95 (1.31%) |
464.95 |
464.30 - 479.95 |
0.7591 times |
Wed 02 July 2025 |
473.75 (0.63%) |
462.50 |
462.50 - 473.75 |
1.0223 times |
Tue 01 July 2025 |
470.80 (-2%) |
470.80 |
470.80 - 470.80 |
0.1215 times |
Mon 30 June 2025 |
480.40 (-2%) |
480.40 |
480.40 - 480.40 |
0.1619 times |
Fri 27 June 2025 |
490.20 (2%) |
490.20 |
490.20 - 490.20 |
0.5972 times |
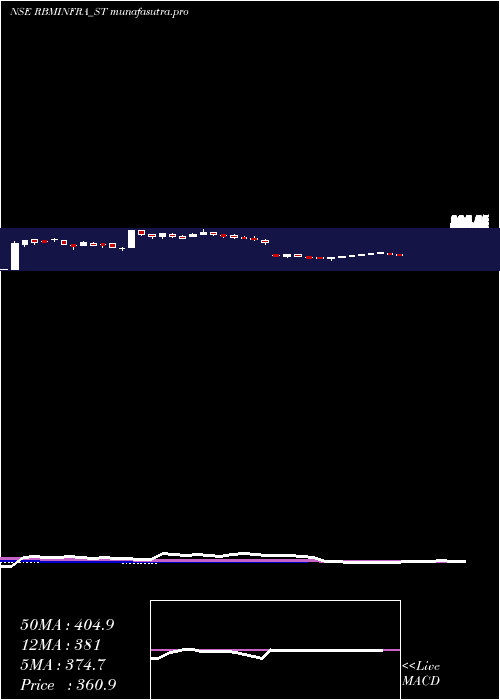
Weekly price and charts RbmInfracon Strong weekly Stock price targets for RbmInfracon RBMINFRA_ST are 396.3 and 453.25 | Weekly Target 1 | 386.23 | | Weekly Target 2 | 406.37 | | Weekly Target 3 | 443.18333333333 | | Weekly Target 4 | 463.32 | | Weekly Target 5 | 500.13 |
Weekly price and volumes for Rbm Infracon
| Date |
Closing |
Open |
Range |
Volume |
Fri 11 July 2025 |
426.50 (-11.12%) |
480.00 |
423.05 - 480.00 |
1.2335 times |
Fri 04 July 2025 |
479.85 (-2.11%) |
480.40 |
462.50 - 482.95 |
0.4428 times |
Fri 27 June 2025 |
490.20 (6.06%) |
452.95 |
452.95 - 490.20 |
0.5548 times |
Fri 20 June 2025 |
462.20 (-6.36%) |
500.00 |
462.20 - 503.00 |
0.2782 times |
Fri 13 June 2025 |
493.60 (8.01%) |
466.10 |
462.00 - 493.60 |
1.1707 times |
Fri 06 June 2025 |
457.00 (3.86%) |
448.80 |
448.80 - 466.00 |
0.9637 times |
Fri 30 May 2025 |
440.00 (8.59%) |
425.45 |
420.00 - 460.00 |
1.8968 times |
Fri 23 May 2025 |
405.20 (9.35%) |
370.55 |
360.00 - 405.80 |
1.2572 times |
Fri 16 May 2025 |
370.55 (6.91%) |
339.70 |
339.70 - 387.75 |
1.5524 times |
Fri 09 May 2025 |
346.60 (-9.59%) |
375.70 |
346.60 - 376.70 |
0.6498 times |
Fri 02 May 2025 |
383.35 (-7.75%) |
407.25 |
383.35 - 407.25 |
0.1103 times |
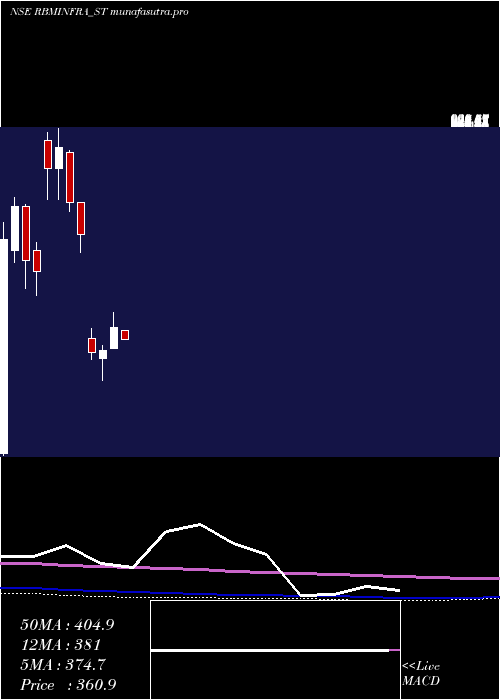
Monthly price and charts RbmInfracon Strong monthly Stock price targets for RbmInfracon RBMINFRA_ST are 394.83 and 454.73 | Monthly Target 1 | 384.27 | | Monthly Target 2 | 405.38 | | Monthly Target 3 | 444.16666666667 | | Monthly Target 4 | 465.28 | | Monthly Target 5 | 504.07 |
Monthly price and volumes Rbm Infracon
| Date |
Closing |
Open |
Range |
Volume |
Fri 11 July 2025 |
426.50 (-11.22%) |
470.80 |
423.05 - 482.95 |
0.4794 times |
Mon 30 June 2025 |
480.40 (9.18%) |
448.80 |
448.80 - 503.00 |
0.8705 times |
Fri 30 May 2025 |
440.00 (12.49%) |
383.35 |
339.70 - 460.00 |
1.5645 times |
Wed 30 April 2025 |
391.15 (19%) |
334.95 |
334.95 - 432.45 |
0.4039 times |
Fri 28 March 2025 |
328.70 (1.28%) |
308.35 |
249.85 - 342.25 |
2.0952 times |
Fri 28 February 2025 |
324.55 (-49.53%) |
361.20 |
305.80 - 389.00 |
1.5877 times |
Fri 10 January 2025 |
643.00 (-11.95%) |
729.95 |
594.00 - 731.00 |
0.5855 times |
Tue 31 December 2024 |
730.25 (-16.92%) |
866.05 |
705.00 - 870.00 |
0.8927 times |
Fri 29 November 2024 |
878.95 (6.73%) |
823.55 |
737.10 - 930.00 |
0.7995 times |
Thu 31 October 2024 |
823.55 (51.75%) |
899.00 |
737.50 - 920.00 |
0.7211 times |
Mon 22 April 2024 |
542.70 (-5.3%) |
600.00 |
478.55 - 622.00 |
0.328 times |
DMA SMA EMA moving averages of Rbm Infracon RBMINFRA_ST
DMA (daily moving average) of Rbm Infracon RBMINFRA_ST
| DMA period | DMA value | | 5 day DMA | 449.84 | | 12 day DMA | 467.06 | | 20 day DMA | 469.9 | | 35 day DMA | 464.58 | | 50 day DMA | 436.62 | | 100 day DMA | 390.11 | | 150 day DMA | 521.22 | | 200 day DMA | 556.53 | EMA (exponential moving average) of Rbm Infracon RBMINFRA_ST
| EMA period | EMA current | EMA prev | EMA prev2 | | 5 day EMA | 446.91 | 457.11 | 463.89 | | 12 day EMA | 459.08 | 465 | 468.9 | | 20 day EMA | 460.91 | 464.53 | 466.74 | | 35 day EMA | 449.07 | 450.4 | 450.8 | | 50 day EMA | 434.74 | 435.08 | 434.73 |
SMA (simple moving average) of Rbm Infracon RBMINFRA_ST
| SMA period | SMA current | SMA prev | SMA prev2 | | 5 day SMA | 449.84 | 460.51 | 467.79 | | 12 day SMA | 467.06 | 470.79 | 472.33 | | 20 day SMA | 469.9 | 473.25 | 475.27 | | 35 day SMA | 464.58 | 463.97 | 462.34 | | 50 day SMA | 436.62 | 435.76 | 434.71 | | 100 day SMA | 390.11 | 392.28 | 394 | | 150 day SMA | 521.22 | 523.45 | 525.52 | | 200 day SMA | 556.53 | 557.75 | 558.98 |
|
|
