RbmInfracon RBMINFRA_SM full analysis,charts,indicators,moving averages,SMA,DMA,EMA,ADX,MACD,RSIRbm Infracon RBMINFRA_SM WideScreen charts, DMA,SMA,EMA technical analysis, forecast prediction, by indicators ADX,MACD,RSI,CCI NSE stock exchange
Daily price and charts and targets RbmInfracon Strong Daily Stock price targets for RbmInfracon RBMINFRA_SM are 407.33 and 423.28 | Daily Target 1 | 404.23 | | Daily Target 2 | 410.42 | | Daily Target 3 | 420.18333333333 | | Daily Target 4 | 426.37 | | Daily Target 5 | 436.13 |
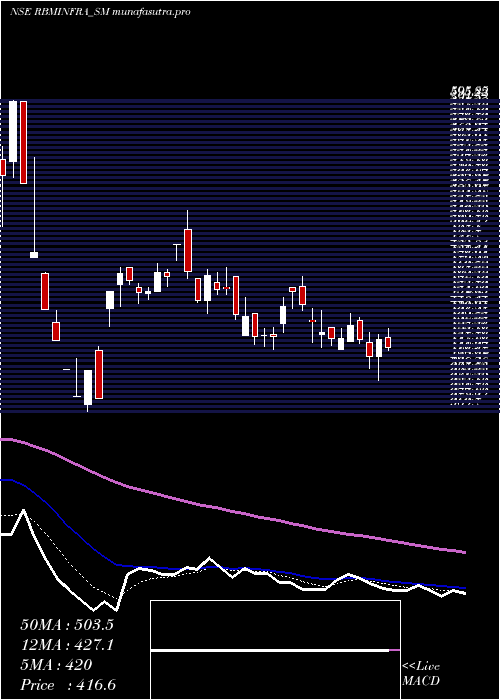
Daily price and volume Rbm Infracon
| Date |
Closing |
Open |
Range |
Volume |
Tue 28 October 2025 |
416.60 (-1.28%) |
423.65 |
414.00 - 429.95 |
0.5927 times |
Mon 27 October 2025 |
422.00 (3.03%) |
410.10 |
392.55 - 426.00 |
0.9698 times |
Fri 24 October 2025 |
409.60 (-2.98%) |
420.05 |
401.00 - 427.00 |
0.9483 times |
Thu 23 October 2025 |
422.20 (-2.3%) |
436.40 |
419.05 - 438.55 |
0.7651 times |
Tue 21 October 2025 |
432.15 (2.2%) |
421.00 |
421.00 - 441.00 |
0.625 times |
Mon 20 October 2025 |
422.85 (0.02%) |
415.00 |
415.00 - 430.00 |
0.9591 times |
Fri 17 October 2025 |
422.75 (-1.04%) |
430.90 |
417.95 - 430.90 |
0.9267 times |
Thu 16 October 2025 |
427.20 (-1.89%) |
425.80 |
416.70 - 443.40 |
1.3578 times |
Wed 15 October 2025 |
435.45 (-2.75%) |
436.00 |
420.00 - 444.85 |
1.4763 times |
Tue 14 October 2025 |
447.75 (-2%) |
461.00 |
443.10 - 468.00 |
1.3793 times |
Mon 13 October 2025 |
456.90 (2.31%) |
459.95 |
445.00 - 459.95 |
1.2608 times |
Weekly price and charts RbmInfracon Strong weekly Stock price targets for RbmInfracon RBMINFRA_SM are 404.58 and 441.98 | Weekly Target 1 | 375.63 | | Weekly Target 2 | 396.12 | | Weekly Target 3 | 413.03333333333 | | Weekly Target 4 | 433.52 | | Weekly Target 5 | 450.43 |
Weekly price and volumes for Rbm Infracon
| Date |
Closing |
Open |
Range |
Volume |
Tue 28 October 2025 |
416.60 (1.71%) |
410.10 |
392.55 - 429.95 |
0.1348 times |
Fri 24 October 2025 |
409.60 (-3.11%) |
415.00 |
401.00 - 441.00 |
0.2844 times |
Fri 17 October 2025 |
422.75 (-5.34%) |
459.95 |
416.70 - 468.00 |
0.5521 times |
Fri 10 October 2025 |
446.60 (1.38%) |
425.00 |
415.15 - 453.00 |
0.3495 times |
Fri 03 October 2025 |
440.50 (-2.27%) |
450.75 |
436.50 - 474.65 |
0.3086 times |
Fri 26 September 2025 |
450.75 (-1.38%) |
457.10 |
449.00 - 515.80 |
0.8924 times |
Fri 19 September 2025 |
457.05 (20.37%) |
445.00 |
432.00 - 474.90 |
0.7009 times |
Mon 10 February 2025 |
379.70 (-4.98%) |
414.20 |
379.65 - 417.00 |
0.5847 times |
Fri 07 February 2025 |
399.60 (-17.66%) |
470.00 |
369.70 - 471.00 |
2.4391 times |
Fri 31 January 2025 |
485.30 (-16.77%) |
583.10 |
481.90 - 595.85 |
3.7535 times |
Fri 24 January 2025 |
583.10 (-18.74%) |
720.00 |
580.70 - 728.60 |
0.5131 times |

Monthly price and charts RbmInfracon Strong monthly Stock price targets for RbmInfracon RBMINFRA_SM are 363.53 and 445.63 | Monthly Target 1 | 345.83 | | Monthly Target 2 | 381.22 | | Monthly Target 3 | 427.93333333333 | | Monthly Target 4 | 463.32 | | Monthly Target 5 | 510.03 |
Monthly price and volumes Rbm Infracon
| Date |
Closing |
Open |
Range |
Volume |
Tue 28 October 2025 |
416.60 (-9.14%) |
460.00 |
392.55 - 474.65 |
0.4738 times |
Tue 30 September 2025 |
458.50 (20.75%) |
445.00 |
432.00 - 515.80 |
0.5516 times |
Mon 10 February 2025 |
379.70 (-21.76%) |
470.00 |
369.70 - 471.00 |
0.9621 times |
Fri 31 January 2025 |
485.30 (-45.34%) |
665.00 |
481.90 - 744.00 |
1.5664 times |
Wed 09 October 2024 |
887.85 (-7.77%) |
980.00 |
845.55 - 1049.00 |
0.6888 times |
Mon 30 September 2024 |
962.65 (30.46%) |
774.00 |
725.05 - 1000.00 |
1.6264 times |
Fri 30 August 2024 |
737.90 (64.71%) |
459.00 |
459.00 - 821.70 |
2.0689 times |
Wed 31 July 2024 |
448.00 (-21.12%) |
590.95 |
440.05 - 626.35 |
0.6501 times |
Fri 28 June 2024 |
567.95 (16.25%) |
512.95 |
450.00 - 609.65 |
0.6264 times |
Fri 31 May 2024 |
488.55 (5.26%) |
464.00 |
421.05 - 585.90 |
0.7853 times |
Tue 30 April 2024 |
464.15 (-30.11%) |
542.70 |
455.00 - 542.70 |
0.1677 times |

DMA SMA EMA moving averages of Rbm Infracon RBMINFRA_SM
DMA (daily moving average) of Rbm Infracon RBMINFRA_SM
| DMA period | DMA value | | 5 day DMA | 420.51 | | 12 day DMA | 430.17 | | 20 day DMA | 435.1 | | 35 day DMA | 438.35 | | 50 day DMA | 488.32 | | 100 day DMA | 637.89 | | 150 day DMA | 602.19 | | 200 day DMA | 578.84 | EMA (exponential moving average) of Rbm Infracon RBMINFRA_SM
| EMA period | EMA current | EMA prev | EMA prev2 | | 5 day EMA | 419.98 | 421.67 | 421.51 | | 12 day EMA | 427.13 | 429.04 | 430.32 | | 20 day EMA | 438.88 | 441.22 | 443.24 | | 35 day EMA | 477.77 | 481.37 | 484.87 | | 50 day EMA | 515.02 | 519.04 | 523 |
SMA (simple moving average) of Rbm Infracon RBMINFRA_SM
| SMA period | SMA current | SMA prev | SMA prev2 | | 5 day SMA | 420.51 | 421.76 | 421.91 | | 12 day SMA | 430.17 | 430.8 | 431.08 | | 20 day SMA | 435.1 | 436.81 | 439.28 | | 35 day SMA | 438.35 | 439.13 | 440.94 | | 50 day SMA | 488.32 | 493.39 | 502.71 | | 100 day SMA | 637.89 | 638.2 | 638.51 | | 150 day SMA | 602.19 | 602.79 | 603.44 | | 200 day SMA | 578.84 | 578.89 | 578.81 |
|
|
