RestaurantBrand RBA full analysis,charts,indicators,moving averages,SMA,DMA,EMA,ADX,MACD,RSIRestaurant Brand RBA WideScreen charts, DMA,SMA,EMA technical analysis, forecast prediction, by indicators ADX,MACD,RSI,CCI NSE stock exchange
Daily price and charts and targets RestaurantBrand Strong Daily Stock price targets for RestaurantBrand RBA are 70.12 and 71.62 | Daily Target 1 | 69.81 | | Daily Target 2 | 70.42 | | Daily Target 3 | 71.306666666667 | | Daily Target 4 | 71.92 | | Daily Target 5 | 72.81 |
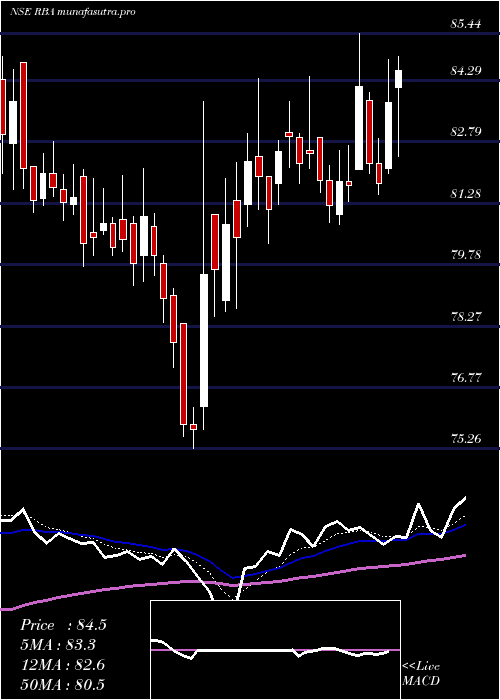
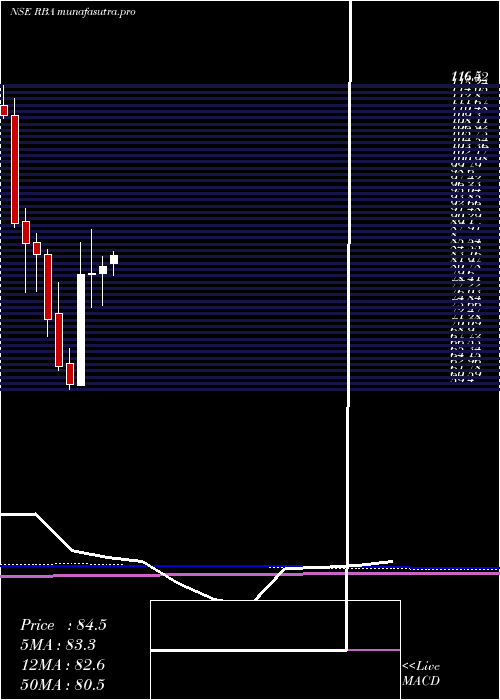
Daily price and volume Restaurant Brand
| Date |
Closing |
Open |
Range |
Volume |
Wed 29 October 2025 |
71.04 (-1.06%) |
71.80 |
70.69 - 72.19 |
0.9586 times |
Tue 28 October 2025 |
71.80 (0.06%) |
71.76 |
71.47 - 72.60 |
1.4448 times |
Mon 27 October 2025 |
71.76 (0.97%) |
71.07 |
70.65 - 72.00 |
0.7769 times |
Fri 24 October 2025 |
71.07 (0.57%) |
70.86 |
70.06 - 71.50 |
0.5132 times |
Thu 23 October 2025 |
70.67 (-0.6%) |
71.16 |
70.16 - 71.81 |
0.9061 times |
Tue 21 October 2025 |
71.10 (0.37%) |
69.80 |
69.80 - 71.44 |
0.3589 times |
Mon 20 October 2025 |
70.84 (2.82%) |
69.20 |
68.43 - 71.00 |
1.2551 times |
Fri 17 October 2025 |
68.90 (-1.85%) |
70.20 |
68.40 - 70.25 |
1.8325 times |
Thu 16 October 2025 |
70.20 (0.19%) |
70.40 |
69.93 - 71.40 |
1.0063 times |
Wed 15 October 2025 |
70.07 (0.24%) |
70.10 |
69.77 - 70.26 |
0.9476 times |
Tue 14 October 2025 |
69.90 (-1.16%) |
70.90 |
69.30 - 71.25 |
1.4447 times |
Weekly price and charts RestaurantBrand Strong weekly Stock price targets for RestaurantBrand RBA are 69.87 and 71.82 | Weekly Target 1 | 69.48 | | Weekly Target 2 | 70.26 | | Weekly Target 3 | 71.43 | | Weekly Target 4 | 72.21 | | Weekly Target 5 | 73.38 |
Weekly price and volumes for Restaurant Brand
| Date |
Closing |
Open |
Range |
Volume |
Wed 29 October 2025 |
71.04 (-0.04%) |
71.07 |
70.65 - 72.60 |
0.3496 times |
Fri 24 October 2025 |
71.07 (3.15%) |
69.20 |
68.43 - 71.81 |
0.3335 times |
Fri 17 October 2025 |
68.90 (-4.19%) |
72.00 |
68.40 - 72.23 |
0.7545 times |
Fri 10 October 2025 |
71.91 (-8.85%) |
79.00 |
69.93 - 81.80 |
1.7071 times |
Fri 03 October 2025 |
78.89 (-0.39%) |
80.00 |
76.52 - 80.00 |
0.5149 times |
Fri 26 September 2025 |
79.20 (-7.78%) |
85.11 |
78.76 - 85.83 |
1.6691 times |
Fri 19 September 2025 |
85.88 (5.79%) |
81.40 |
79.64 - 87.65 |
2.4871 times |
Fri 12 September 2025 |
81.18 (2.07%) |
79.90 |
77.59 - 83.85 |
0.9069 times |
Fri 05 September 2025 |
79.53 (-0.48%) |
80.00 |
79.06 - 84.09 |
0.8192 times |
Fri 29 August 2025 |
79.91 (-0.32%) |
80.50 |
76.51 - 81.00 |
0.4582 times |
Fri 22 August 2025 |
80.17 (1.75%) |
79.78 |
77.36 - 84.00 |
0.5785 times |

Monthly price and charts RestaurantBrand Strong monthly Stock price targets for RestaurantBrand RBA are 63.02 and 76.42 | Monthly Target 1 | 60.35 | | Monthly Target 2 | 65.69 | | Monthly Target 3 | 73.746666666667 | | Monthly Target 4 | 79.09 | | Monthly Target 5 | 87.15 |
Monthly price and volumes Restaurant Brand
| Date |
Closing |
Open |
Range |
Volume |
Wed 29 October 2025 |
71.04 (-7.7%) |
77.00 |
68.40 - 81.80 |
0.6961 times |
Tue 30 September 2025 |
76.97 (-3.68%) |
80.00 |
76.52 - 87.65 |
1.282 times |
Fri 29 August 2025 |
79.91 (-1.85%) |
81.70 |
76.51 - 85.65 |
0.4286 times |
Thu 31 July 2025 |
81.42 (-1.37%) |
83.03 |
80.76 - 87.55 |
0.585 times |
Mon 30 June 2025 |
82.55 (1.54%) |
81.25 |
75.26 - 84.34 |
1.5719 times |
Fri 30 May 2025 |
81.30 (0.35%) |
81.02 |
74.90 - 89.50 |
0.9553 times |
Wed 30 April 2025 |
81.02 (34.03%) |
60.26 |
60.20 - 87.00 |
1.784 times |
Fri 28 March 2025 |
60.45 (-5.22%) |
64.38 |
59.40 - 67.13 |
0.942 times |
Fri 28 February 2025 |
63.78 (-12.19%) |
73.79 |
63.00 - 79.44 |
0.8588 times |
Fri 31 January 2025 |
72.63 (-14.43%) |
84.80 |
69.45 - 85.75 |
0.8964 times |
Tue 31 December 2024 |
84.88 (-2.28%) |
87.00 |
77.90 - 88.70 |
0.7953 times |
DMA SMA EMA moving averages of Restaurant Brand RBA
DMA (daily moving average) of Restaurant Brand RBA
| DMA period | DMA value | | 5 day DMA | 71.27 | | 12 day DMA | 70.67 | | 20 day DMA | 72.65 | | 35 day DMA | 76.39 | | 50 day DMA | 77.57 | | 100 day DMA | 79.43 | | 150 day DMA | 78.47 | | 200 day DMA | 76.64 | EMA (exponential moving average) of Restaurant Brand RBA
| EMA period | EMA current | EMA prev | EMA prev2 | | 5 day EMA | 71.25 | 71.35 | 71.12 | | 12 day EMA | 71.68 | 71.8 | 71.8 | | 20 day EMA | 72.91 | 73.11 | 73.25 | | 35 day EMA | 74.72 | 74.94 | 75.13 | | 50 day EMA | 77.06 | 77.31 | 77.53 |
SMA (simple moving average) of Restaurant Brand RBA
| SMA period | SMA current | SMA prev | SMA prev2 | | 5 day SMA | 71.27 | 71.28 | 71.09 | | 12 day SMA | 70.67 | 70.75 | 70.68 | | 20 day SMA | 72.65 | 72.98 | 73.35 | | 35 day SMA | 76.39 | 76.65 | 76.87 | | 50 day SMA | 77.57 | 77.72 | 77.87 | | 100 day SMA | 79.43 | 79.53 | 79.62 | | 150 day SMA | 78.47 | 78.41 | 78.35 | | 200 day SMA | 76.64 | 76.7 | 76.76 |
|
|
