RaneHoldings RANEHOLDIN full analysis,charts,indicators,moving averages,SMA,DMA,EMA,ADX,MACD,RSIRane Holdings RANEHOLDIN WideScreen charts, DMA,SMA,EMA technical analysis, forecast prediction, by indicators ADX,MACD,RSI,CCI NSE stock exchange
operates under Auto Parts & Equipment sector
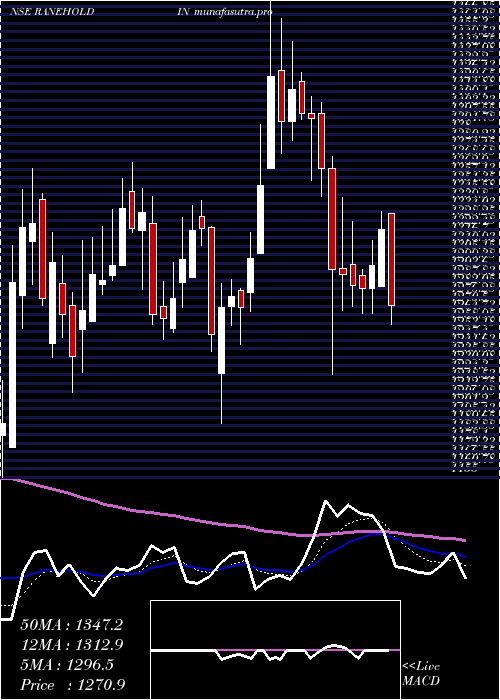
Daily price and charts and targets RaneHoldings Strong Daily Stock price targets for RaneHoldings RANEHOLDIN are 1536.15 and 1574.95 | Daily Target 1 | 1506.97 | | Daily Target 2 | 1526.53 | | Daily Target 3 | 1545.7666666667 | | Daily Target 4 | 1565.33 | | Daily Target 5 | 1584.57 |
Daily price and volume Rane Holdings
| Date |
Closing |
Open |
Range |
Volume |
Wed 29 October 2025 |
1546.10 (0.79%) |
1534.00 |
1526.20 - 1565.00 |
0.9453 times |
Tue 28 October 2025 |
1534.00 (-0.29%) |
1539.00 |
1529.20 - 1564.00 |
0.8164 times |
Mon 27 October 2025 |
1538.50 (0.77%) |
1532.40 |
1520.70 - 1544.70 |
0.7393 times |
Fri 24 October 2025 |
1526.80 (-0.35%) |
1535.30 |
1517.00 - 1548.00 |
0.6517 times |
Thu 23 October 2025 |
1532.20 (-0.8%) |
1544.60 |
1521.90 - 1548.80 |
1.5528 times |
Tue 21 October 2025 |
1544.60 (1.38%) |
1538.00 |
1525.60 - 1550.00 |
0.2328 times |
Mon 20 October 2025 |
1523.50 (1.03%) |
1507.90 |
1500.60 - 1531.00 |
0.4257 times |
Fri 17 October 2025 |
1507.90 (0.03%) |
1506.20 |
1500.00 - 1538.00 |
2.3282 times |
Thu 16 October 2025 |
1507.40 (-0.24%) |
1519.90 |
1500.10 - 1533.50 |
0.8989 times |
Wed 15 October 2025 |
1511.00 (-1.07%) |
1534.80 |
1501.40 - 1570.00 |
1.409 times |
Tue 14 October 2025 |
1527.40 (-0.56%) |
1540.90 |
1515.00 - 1550.00 |
0.955 times |
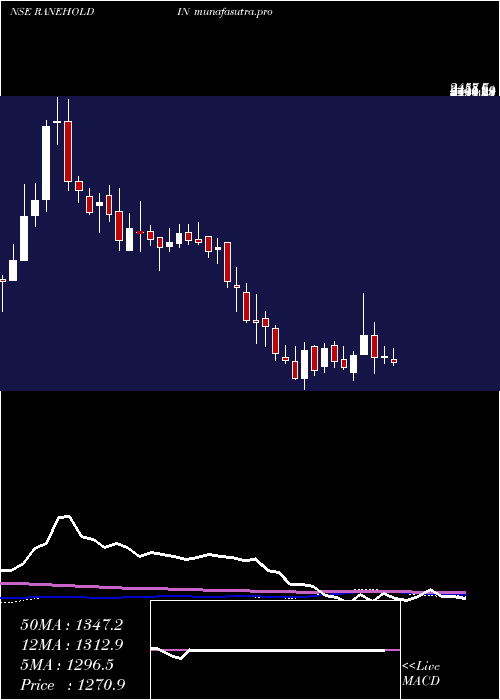
Weekly price and charts RaneHoldings Strong weekly Stock price targets for RaneHoldings RANEHOLDIN are 1533.4 and 1577.7 | Weekly Target 1 | 1499.63 | | Weekly Target 2 | 1522.87 | | Weekly Target 3 | 1543.9333333333 | | Weekly Target 4 | 1567.17 | | Weekly Target 5 | 1588.23 |
Weekly price and volumes for Rane Holdings
| Date |
Closing |
Open |
Range |
Volume |
Wed 29 October 2025 |
1546.10 (1.26%) |
1532.40 |
1520.70 - 1565.00 |
0.265 times |
Fri 24 October 2025 |
1526.80 (1.25%) |
1507.90 |
1500.60 - 1550.00 |
0.3033 times |
Fri 17 October 2025 |
1507.90 (-4.18%) |
1573.70 |
1500.00 - 1580.00 |
0.7667 times |
Fri 10 October 2025 |
1573.70 (-6.96%) |
1700.10 |
1557.00 - 1798.00 |
1.1326 times |
Fri 03 October 2025 |
1691.50 (5.09%) |
1610.00 |
1570.00 - 1699.00 |
0.9591 times |
Fri 26 September 2025 |
1609.50 (7.57%) |
1496.20 |
1443.80 - 1748.00 |
3.7065 times |
Fri 19 September 2025 |
1496.20 (-0.43%) |
1495.00 |
1482.10 - 1550.00 |
0.9973 times |
Fri 12 September 2025 |
1502.70 (0.21%) |
1522.00 |
1479.50 - 1559.00 |
0.7361 times |
Fri 05 September 2025 |
1499.50 (-0.27%) |
1503.50 |
1484.20 - 1572.00 |
0.8867 times |
Fri 29 August 2025 |
1503.50 (-0.34%) |
1508.60 |
1490.00 - 1518.00 |
0.2467 times |
Fri 22 August 2025 |
1508.60 (2%) |
1498.00 |
1455.30 - 1526.80 |
0.6724 times |
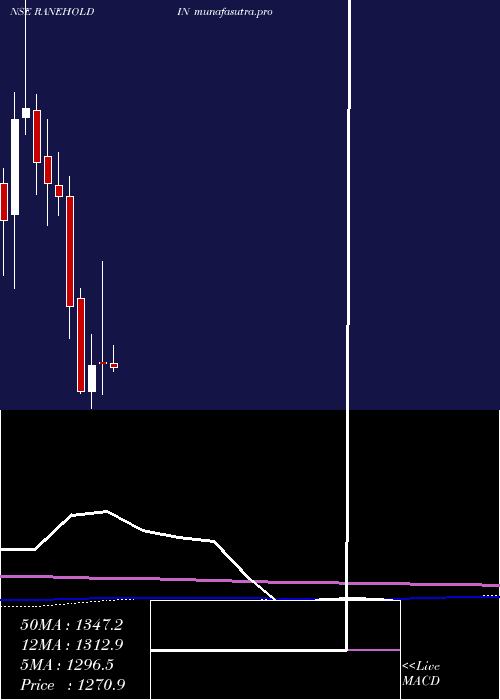
Monthly price and charts RaneHoldings Strong monthly Stock price targets for RaneHoldings RANEHOLDIN are 1374.05 and 1672.05 | Monthly Target 1 | 1316.7 | | Monthly Target 2 | 1431.4 | | Monthly Target 3 | 1614.7 | | Monthly Target 4 | 1729.4 | | Monthly Target 5 | 1912.7 |
Monthly price and volumes Rane Holdings
| Date |
Closing |
Open |
Range |
Volume |
Wed 29 October 2025 |
1546.10 (-4.44%) |
1620.00 |
1500.00 - 1798.00 |
0.7724 times |
Tue 30 September 2025 |
1618.00 (7.62%) |
1503.50 |
1443.80 - 1748.00 |
1.6679 times |
Fri 29 August 2025 |
1503.50 (-1.17%) |
1492.00 |
1432.00 - 1580.00 |
0.6546 times |
Thu 31 July 2025 |
1521.30 (-4.43%) |
1605.70 |
1488.00 - 1642.80 |
0.7663 times |
Mon 30 June 2025 |
1591.80 (4.88%) |
1560.10 |
1491.60 - 1615.00 |
0.9194 times |
Fri 30 May 2025 |
1517.70 (18.33%) |
1282.60 |
1232.00 - 1575.00 |
0.9993 times |
Wed 30 April 2025 |
1282.60 (0.53%) |
1286.00 |
1191.60 - 1579.90 |
1.6138 times |
Fri 28 March 2025 |
1275.85 (6.28%) |
1199.95 |
1151.10 - 1367.20 |
1.0329 times |
Fri 28 February 2025 |
1200.50 (-17.15%) |
1471.00 |
1195.00 - 1500.00 |
0.8172 times |
Fri 31 January 2025 |
1448.95 (-18.09%) |
1770.00 |
1355.00 - 1828.00 |
0.7561 times |
Tue 31 December 2024 |
1768.95 (-2.21%) |
1803.25 |
1714.05 - 1897.90 |
0.9316 times |
DMA SMA EMA moving averages of Rane Holdings RANEHOLDIN
DMA (daily moving average) of Rane Holdings RANEHOLDIN
| DMA period | DMA value | | 5 day DMA | 1535.52 | | 12 day DMA | 1527.95 | | 20 day DMA | 1565.14 | | 35 day DMA | 1555.34 | | 50 day DMA | 1539.74 | | 100 day DMA | 1543.14 | | 150 day DMA | 1486.95 | | 200 day DMA | 1465.48 | EMA (exponential moving average) of Rane Holdings RANEHOLDIN
| EMA period | EMA current | EMA prev | EMA prev2 | | 5 day EMA | 1537.43 | 1533.09 | 1532.64 | | 12 day EMA | 1541.25 | 1540.37 | 1541.53 | | 20 day EMA | 1546.76 | 1546.83 | 1548.18 | | 35 day EMA | 1541.63 | 1541.37 | 1541.8 | | 50 day EMA | 1534.45 | 1533.97 | 1533.97 |
SMA (simple moving average) of Rane Holdings RANEHOLDIN
| SMA period | SMA current | SMA prev | SMA prev2 | | 5 day SMA | 1535.52 | 1535.22 | 1533.12 | | 12 day SMA | 1527.95 | 1530.25 | 1534.08 | | 20 day SMA | 1565.14 | 1566.61 | 1570.39 | | 35 day SMA | 1555.34 | 1554.63 | 1553.65 | | 50 day SMA | 1539.74 | 1538.4 | 1538.24 | | 100 day SMA | 1543.14 | 1542.99 | 1542.76 | | 150 day SMA | 1486.95 | 1485.29 | 1483.65 | | 200 day SMA | 1465.48 | 1466.45 | 1467.3 |
|
|
