RajTelevision RAJTV full analysis,charts,indicators,moving averages,SMA,DMA,EMA,ADX,MACD,RSIRaj Television RAJTV WideScreen charts, DMA,SMA,EMA technical analysis, forecast prediction, by indicators ADX,MACD,RSI,CCI NSE stock exchange
operates under Broadcasting & Cable TV sector
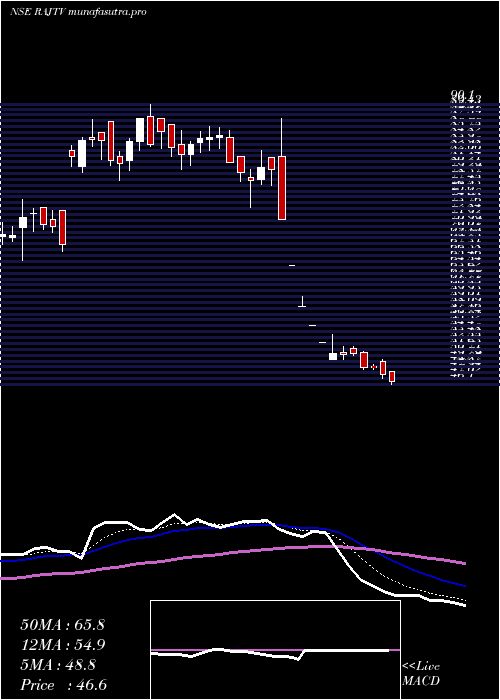
Daily price and charts and targets RajTelevision Strong Daily Stock price targets for RajTelevision RAJTV are 40.58 and 41.14 | Daily Target 1 | 40.45 | | Daily Target 2 | 40.7 | | Daily Target 3 | 41.006666666667 | | Daily Target 4 | 41.26 | | Daily Target 5 | 41.57 |
Daily price and volume Raj Television
| Date |
Closing |
Open |
Range |
Volume |
Tue 28 October 2025 |
40.96 (0.47%) |
41.11 |
40.75 - 41.31 |
2.0285 times |
Mon 27 October 2025 |
40.77 (-0.17%) |
40.77 |
40.76 - 41.40 |
2.1626 times |
Fri 24 October 2025 |
40.84 (0.12%) |
41.48 |
40.81 - 41.83 |
1.1609 times |
Thu 23 October 2025 |
40.79 (-1.64%) |
41.00 |
40.75 - 41.55 |
0.7465 times |
Tue 21 October 2025 |
41.47 (1.94%) |
41.39 |
41.39 - 41.80 |
0.1674 times |
Mon 20 October 2025 |
40.68 (0.17%) |
40.66 |
40.65 - 41.44 |
1.3246 times |
Fri 17 October 2025 |
40.61 (-1.38%) |
41.18 |
40.60 - 41.18 |
0.0962 times |
Thu 16 October 2025 |
41.18 (1.15%) |
41.38 |
40.55 - 41.40 |
0.8362 times |
Wed 15 October 2025 |
40.71 (-0.12%) |
41.44 |
40.70 - 41.44 |
1.0586 times |
Tue 14 October 2025 |
40.76 (0.15%) |
40.67 |
40.67 - 41.00 |
0.4186 times |
Mon 13 October 2025 |
40.70 (-0.2%) |
41.48 |
40.60 - 41.48 |
0.5531 times |
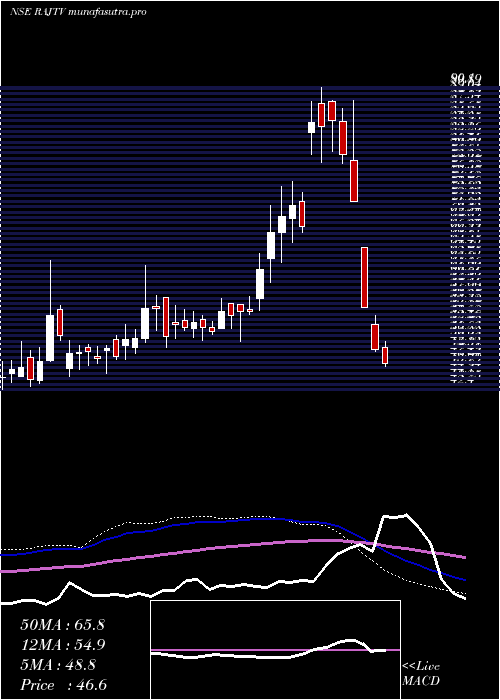
Weekly price and charts RajTelevision Strong weekly Stock price targets for RajTelevision RAJTV are 40.86 and 41.51 | Weekly Target 1 | 40.39 | | Weekly Target 2 | 40.67 | | Weekly Target 3 | 41.036666666667 | | Weekly Target 4 | 41.32 | | Weekly Target 5 | 41.69 |
Weekly price and volumes for Raj Television
| Date |
Closing |
Open |
Range |
Volume |
Tue 28 October 2025 |
40.96 (0.29%) |
40.77 |
40.75 - 41.40 |
0.4463 times |
Fri 24 October 2025 |
40.84 (0.57%) |
40.66 |
40.65 - 41.83 |
0.362 times |
Fri 17 October 2025 |
40.61 (-0.42%) |
41.48 |
40.55 - 41.48 |
0.3155 times |
Fri 10 October 2025 |
40.78 (-1.78%) |
41.00 |
40.55 - 42.71 |
0.6764 times |
Fri 03 October 2025 |
41.52 (2.12%) |
41.30 |
40.31 - 42.76 |
0.4053 times |
Fri 26 September 2025 |
40.66 (-2.68%) |
43.78 |
40.22 - 43.78 |
0.7512 times |
Fri 19 September 2025 |
41.78 (-0.95%) |
42.10 |
41.00 - 43.49 |
2.2163 times |
Fri 12 September 2025 |
42.18 (-1.72%) |
42.04 |
40.17 - 43.99 |
1.8015 times |
Fri 05 September 2025 |
42.92 (3.22%) |
41.02 |
41.01 - 43.80 |
0.8668 times |
Fri 29 August 2025 |
41.58 (-7.08%) |
45.25 |
40.95 - 46.55 |
2.1588 times |
Fri 22 August 2025 |
44.75 (7.81%) |
43.01 |
41.15 - 45.69 |
2.2512 times |
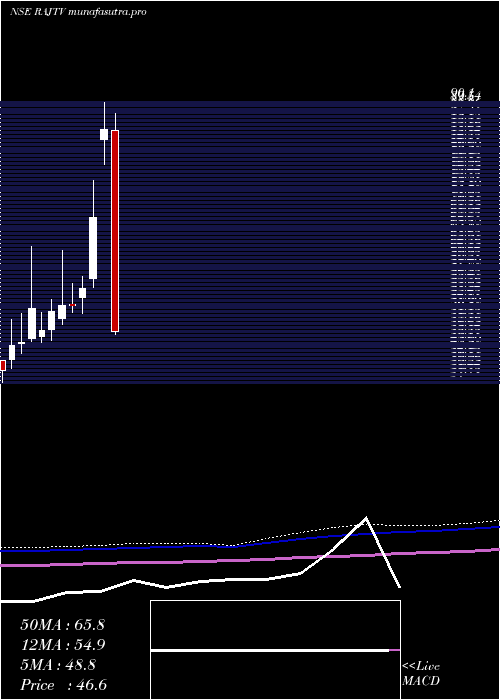
Monthly price and charts RajTelevision Strong monthly Stock price targets for RajTelevision RAJTV are 39.41 and 41.86 | Monthly Target 1 | 38.89 | | Monthly Target 2 | 39.93 | | Monthly Target 3 | 41.343333333333 | | Monthly Target 4 | 42.38 | | Monthly Target 5 | 43.79 |
Monthly price and volumes Raj Television
| Date |
Closing |
Open |
Range |
Volume |
Tue 28 October 2025 |
40.96 (-0.15%) |
42.00 |
40.31 - 42.76 |
0.0523 times |
Tue 30 September 2025 |
41.02 (-1.35%) |
41.02 |
40.17 - 43.99 |
0.1624 times |
Fri 29 August 2025 |
41.58 (-5.86%) |
43.38 |
40.95 - 46.55 |
0.133 times |
Fri 09 May 2025 |
44.17 (-5.13%) |
47.43 |
43.15 - 48.61 |
0.0983 times |
Wed 30 April 2025 |
46.56 (-45.13%) |
84.71 |
46.10 - 88.00 |
3.0447 times |
Fri 28 March 2025 |
84.86 (24.52%) |
83.00 |
78.20 - 90.10 |
0.9026 times |
Tue 30 January 2024 |
68.15 (24.59%) |
56.70 |
54.90 - 75.25 |
2.8679 times |
Fri 29 December 2023 |
54.70 (6.21%) |
53.05 |
50.00 - 57.00 |
0.4688 times |
Thu 30 November 2023 |
51.50 (0.1%) |
51.80 |
50.20 - 55.65 |
0.2265 times |
Tue 31 October 2023 |
51.45 (2.29%) |
49.05 |
48.00 - 62.00 |
2.0436 times |
Fri 29 September 2023 |
50.30 (7.48%) |
47.05 |
44.85 - 52.65 |
0.4212 times |
DMA SMA EMA moving averages of Raj Television RAJTV
DMA (daily moving average) of Raj Television RAJTV
| DMA period | DMA value | | 5 day DMA | 40.97 | | 12 day DMA | 40.85 | | 20 day DMA | 41 | | 35 day DMA | 41.35 | | 50 day DMA | 41.77 | | 100 day DMA | 54.46 | | 150 day DMA | 55.1 | | 200 day DMA | 53.98 | EMA (exponential moving average) of Raj Television RAJTV
| EMA period | EMA current | EMA prev | EMA prev2 | | 5 day EMA | 40.89 | 40.86 | 40.91 | | 12 day EMA | 40.93 | 40.93 | 40.96 | | 20 day EMA | 41.05 | 41.06 | 41.09 | | 35 day EMA | 41.44 | 41.47 | 41.51 | | 50 day EMA | 41.83 | 41.87 | 41.92 |
SMA (simple moving average) of Raj Television RAJTV
| SMA period | SMA current | SMA prev | SMA prev2 | | 5 day SMA | 40.97 | 40.91 | 40.88 | | 12 day SMA | 40.85 | 40.84 | 40.9 | | 20 day SMA | 41 | 40.98 | 40.99 | | 35 day SMA | 41.35 | 41.4 | 41.45 | | 50 day SMA | 41.77 | 41.8 | 41.84 | | 100 day SMA | 54.46 | 54.77 | 55.03 | | 150 day SMA | 55.1 | 55.19 | 55.27 | | 200 day SMA | 53.98 | 54.01 | 54.04 |
|
|
