RadiantCash RADIANTCMS full analysis,charts,indicators,moving averages,SMA,DMA,EMA,ADX,MACD,RSIRadiant Cash RADIANTCMS WideScreen charts, DMA,SMA,EMA technical analysis, forecast prediction, by indicators ADX,MACD,RSI,CCI NSE stock exchange
Daily price and charts and targets RadiantCash Strong Daily Stock price targets for RadiantCash RADIANTCMS are 51.67 and 53.9 | Daily Target 1 | 51.23 | | Daily Target 2 | 52.1 | | Daily Target 3 | 53.463333333333 | | Daily Target 4 | 54.33 | | Daily Target 5 | 55.69 |
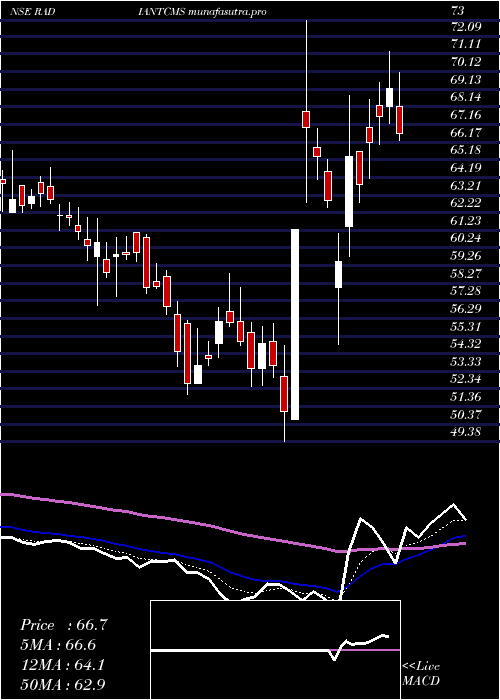
Daily price and volume Radiant Cash
| Date |
Closing |
Open |
Range |
Volume |
Tue 28 October 2025 |
52.96 (-2.45%) |
53.60 |
52.60 - 54.83 |
1.3804 times |
Mon 27 October 2025 |
54.29 (1.02%) |
53.70 |
53.52 - 54.69 |
0.7269 times |
Fri 24 October 2025 |
53.74 (0.94%) |
53.78 |
53.51 - 54.23 |
0.8884 times |
Thu 23 October 2025 |
53.24 (-3.53%) |
55.50 |
52.93 - 55.50 |
2.5375 times |
Tue 21 October 2025 |
55.19 (0.31%) |
55.02 |
53.36 - 55.88 |
0.4771 times |
Mon 20 October 2025 |
55.02 (-2.83%) |
55.90 |
54.76 - 57.01 |
0.8512 times |
Fri 17 October 2025 |
56.62 (0.19%) |
56.41 |
55.96 - 56.70 |
0.5493 times |
Thu 16 October 2025 |
56.51 (0.91%) |
55.35 |
55.35 - 56.89 |
0.9611 times |
Wed 15 October 2025 |
56.00 (1.32%) |
54.41 |
54.41 - 56.27 |
0.619 times |
Tue 14 October 2025 |
55.27 (-0.43%) |
54.90 |
54.00 - 55.99 |
1.009 times |
Mon 13 October 2025 |
55.51 (-1.09%) |
56.01 |
55.15 - 56.60 |
0.7893 times |
Weekly price and charts RadiantCash Strong weekly Stock price targets for RadiantCash RADIANTCMS are 51.67 and 53.9 | Weekly Target 1 | 51.23 | | Weekly Target 2 | 52.1 | | Weekly Target 3 | 53.463333333333 | | Weekly Target 4 | 54.33 | | Weekly Target 5 | 55.69 |
Weekly price and volumes for Radiant Cash
| Date |
Closing |
Open |
Range |
Volume |
Tue 28 October 2025 |
52.96 (-1.45%) |
53.70 |
52.60 - 54.83 |
0.3997 times |
Fri 24 October 2025 |
53.74 (-5.09%) |
55.90 |
52.93 - 57.01 |
0.9018 times |
Fri 17 October 2025 |
56.62 (0.89%) |
56.01 |
54.00 - 56.89 |
0.745 times |
Fri 10 October 2025 |
56.12 (2.11%) |
55.66 |
55.11 - 57.49 |
0.7578 times |
Fri 03 October 2025 |
54.96 (0%) |
54.98 |
51.72 - 55.50 |
0.795 times |
Fri 26 September 2025 |
54.96 (-1.87%) |
57.00 |
54.50 - 57.00 |
0.7523 times |
Fri 19 September 2025 |
56.01 (0.97%) |
55.20 |
55.20 - 57.00 |
0.7158 times |
Fri 12 September 2025 |
55.47 (-1.12%) |
56.87 |
55.10 - 57.34 |
0.9052 times |
Fri 05 September 2025 |
56.10 (-5.89%) |
59.70 |
54.90 - 62.30 |
2.9052 times |
Fri 29 August 2025 |
59.61 (0.68%) |
59.50 |
58.60 - 60.90 |
1.1221 times |
Fri 22 August 2025 |
59.21 (15.28%) |
51.79 |
51.41 - 60.00 |
2.073 times |

Monthly price and charts RadiantCash Strong monthly Stock price targets for RadiantCash RADIANTCMS are 50.34 and 55.23 | Monthly Target 1 | 49.46 | | Monthly Target 2 | 51.21 | | Monthly Target 3 | 54.35 | | Monthly Target 4 | 56.1 | | Monthly Target 5 | 59.24 |
Monthly price and volumes Radiant Cash
| Date |
Closing |
Open |
Range |
Volume |
Tue 28 October 2025 |
52.96 (-0.02%) |
53.30 |
52.60 - 57.49 |
0.2985 times |
Tue 30 September 2025 |
52.97 (-11.14%) |
59.70 |
51.72 - 62.30 |
0.5451 times |
Fri 29 August 2025 |
59.61 (4.21%) |
57.00 |
49.40 - 62.40 |
0.8484 times |
Thu 31 July 2025 |
57.20 (-10.12%) |
64.00 |
54.92 - 64.59 |
1.005 times |
Mon 30 June 2025 |
63.64 (-1.99%) |
64.98 |
60.40 - 68.69 |
0.7531 times |
Fri 30 May 2025 |
64.93 (0.73%) |
64.46 |
60.00 - 73.80 |
1.0015 times |
Wed 30 April 2025 |
64.46 (26.19%) |
50.60 |
50.60 - 73.00 |
2.5015 times |
Fri 28 March 2025 |
51.08 (-15.39%) |
59.75 |
49.38 - 61.90 |
2.2644 times |
Fri 28 February 2025 |
60.37 (-9.77%) |
68.00 |
59.56 - 68.00 |
0.389 times |
Fri 31 January 2025 |
66.91 (-10.81%) |
75.70 |
65.00 - 77.03 |
0.3937 times |
Tue 31 December 2024 |
75.02 (-4.71%) |
79.74 |
73.72 - 81.00 |
0.4809 times |

DMA SMA EMA moving averages of Radiant Cash RADIANTCMS
DMA (daily moving average) of Radiant Cash RADIANTCMS
| DMA period | DMA value | | 5 day DMA | 53.88 | | 12 day DMA | 55.04 | | 20 day DMA | 54.98 | | 35 day DMA | 55.4 | | 50 day DMA | 56.02 | | 100 day DMA | 58.43 | | 150 day DMA | 60.46 | | 200 day DMA | 61.68 | EMA (exponential moving average) of Radiant Cash RADIANTCMS
| EMA period | EMA current | EMA prev | EMA prev2 | | 5 day EMA | 53.92 | 54.4 | 54.45 | | 12 day EMA | 54.63 | 54.93 | 55.05 | | 20 day EMA | 54.96 | 55.17 | 55.26 | | 35 day EMA | 55.36 | 55.5 | 55.57 | | 50 day EMA | 55.63 | 55.74 | 55.8 |
SMA (simple moving average) of Radiant Cash RADIANTCMS
| SMA period | SMA current | SMA prev | SMA prev2 | | 5 day SMA | 53.88 | 54.3 | 54.76 | | 12 day SMA | 55.04 | 55.28 | 55.44 | | 20 day SMA | 54.98 | 55.08 | 55.14 | | 35 day SMA | 55.4 | 55.49 | 55.52 | | 50 day SMA | 56.02 | 56.06 | 56.05 | | 100 day SMA | 58.43 | 58.58 | 58.69 | | 150 day SMA | 60.46 | 60.47 | 60.46 | | 200 day SMA | 61.68 | 61.79 | 61.9 |
|
|
