QuestLaboratories QUESTLAB_SM full analysis,charts,indicators,moving averages,SMA,DMA,EMA,ADX,MACD,RSIQuest Laboratories QUESTLAB_SM WideScreen charts, DMA,SMA,EMA technical analysis, forecast prediction, by indicators ADX,MACD,RSI,CCI NSE stock exchange
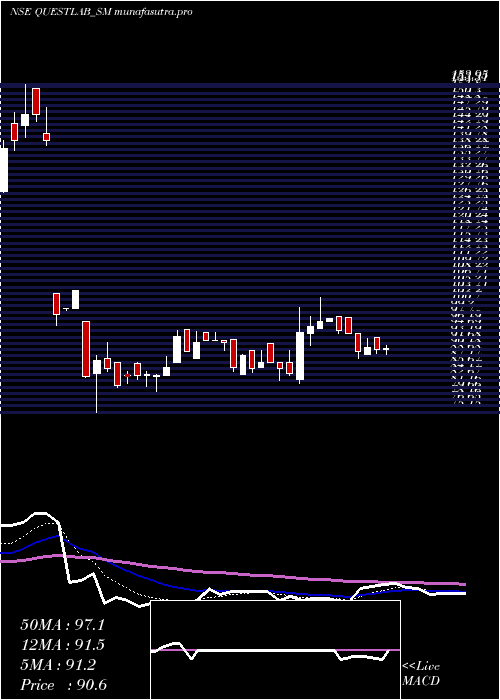
Daily price and charts and targets QuestLaboratories Strong Daily Stock price targets for QuestLaboratories QUESTLAB_SM are 89.03 and 89.48 | Daily Target 1 | 88.65 | | Daily Target 2 | 88.95 | | Daily Target 3 | 89.1 | | Daily Target 4 | 89.4 | | Daily Target 5 | 89.55 |
Daily price and volume Quest Laboratories
| Date |
Closing |
Open |
Range |
Volume |
Tue 28 October 2025 |
89.25 (0.39%) |
88.80 |
88.80 - 89.25 |
2.5 times |
Mon 27 October 2025 |
88.90 (-3%) |
89.95 |
87.20 - 89.95 |
1.0294 times |
Fri 24 October 2025 |
91.65 (2.57%) |
89.35 |
89.35 - 92.00 |
1.6176 times |
Thu 23 October 2025 |
89.35 (0%) |
89.50 |
89.35 - 89.50 |
0.1471 times |
Mon 20 October 2025 |
89.35 (1.53%) |
89.35 |
89.35 - 89.35 |
0.0735 times |
Fri 17 October 2025 |
88.00 (0%) |
88.00 |
88.00 - 88.40 |
0.5882 times |
Thu 16 October 2025 |
88.00 (0%) |
88.00 |
88.00 - 88.00 |
0.2941 times |
Wed 15 October 2025 |
88.00 (-0.11%) |
88.15 |
88.00 - 88.15 |
0.2941 times |
Tue 14 October 2025 |
88.10 (0.11%) |
88.00 |
88.00 - 88.10 |
3.0147 times |
Mon 13 October 2025 |
88.00 (0%) |
89.00 |
88.00 - 91.20 |
0.4412 times |
Fri 10 October 2025 |
88.00 (2.09%) |
84.50 |
84.50 - 88.00 |
0.2941 times |
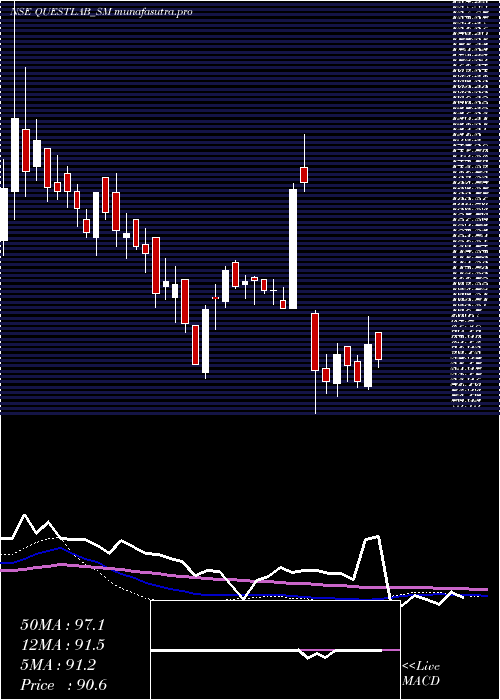
Weekly price and charts QuestLaboratories Strong weekly Stock price targets for QuestLaboratories QUESTLAB_SM are 86.85 and 89.6 | Weekly Target 1 | 86.05 | | Weekly Target 2 | 87.65 | | Weekly Target 3 | 88.8 | | Weekly Target 4 | 90.4 | | Weekly Target 5 | 91.55 |
Weekly price and volumes for Quest Laboratories
| Date |
Closing |
Open |
Range |
Volume |
Tue 28 October 2025 |
89.25 (-2.62%) |
89.95 |
87.20 - 89.95 |
0.6987 times |
Fri 24 October 2025 |
91.65 (4.15%) |
89.35 |
89.35 - 92.00 |
0.3639 times |
Fri 17 October 2025 |
88.00 (0%) |
89.00 |
88.00 - 91.20 |
0.917 times |
Fri 10 October 2025 |
88.00 (-6.83%) |
92.20 |
84.50 - 92.20 |
0.9461 times |
Wed 01 October 2025 |
94.45 (-0.58%) |
96.50 |
90.90 - 96.50 |
1.2518 times |
Fri 26 September 2025 |
95.00 (-1.61%) |
96.00 |
95.00 - 98.10 |
0.786 times |
Fri 19 September 2025 |
96.55 (-0.97%) |
95.00 |
92.00 - 99.00 |
2.1834 times |
Fri 12 September 2025 |
97.50 (-2.01%) |
99.00 |
95.00 - 99.00 |
1.2082 times |
Fri 05 September 2025 |
99.50 (0.81%) |
98.50 |
98.50 - 101.75 |
0.8588 times |
Fri 29 August 2025 |
98.70 (-1.05%) |
99.30 |
98.70 - 101.45 |
0.786 times |
Fri 22 August 2025 |
99.75 (0.66%) |
103.40 |
98.50 - 103.40 |
1.1499 times |
Monthly price and charts QuestLaboratories Strong monthly Stock price targets for QuestLaboratories QUESTLAB_SM are 81.63 and 92.13 | Monthly Target 1 | 79.08 | | Monthly Target 2 | 84.17 | | Monthly Target 3 | 89.583333333333 | | Monthly Target 4 | 94.67 | | Monthly Target 5 | 100.08 |
Monthly price and volumes Quest Laboratories
| Date |
Closing |
Open |
Range |
Volume |
Tue 28 October 2025 |
89.25 (-6.05%) |
92.15 |
84.50 - 95.00 |
0.4413 times |
Tue 30 September 2025 |
95.00 (-3.75%) |
98.50 |
92.00 - 101.75 |
0.6761 times |
Fri 29 August 2025 |
98.70 (-0.15%) |
100.95 |
95.10 - 104.35 |
0.5366 times |
Thu 31 July 2025 |
98.85 (4.94%) |
94.15 |
85.00 - 126.90 |
2.2877 times |
Mon 30 June 2025 |
94.20 (7.72%) |
88.00 |
80.00 - 100.40 |
1.4563 times |
Fri 30 May 2025 |
87.45 (-37.76%) |
103.55 |
75.15 - 104.40 |
1.5569 times |
Thu 09 January 2025 |
140.50 (16.07%) |
124.85 |
118.00 - 153.95 |
1.165 times |
Tue 31 December 2024 |
121.05 (7.7%) |
113.70 |
104.95 - 125.00 |
0.556 times |
Fri 29 November 2024 |
112.40 (10.85%) |
105.75 |
99.05 - 118.50 |
0.5084 times |
Thu 31 October 2024 |
101.40 (-9.46%) |
111.50 |
85.10 - 118.95 |
0.8155 times |
Mon 30 September 2024 |
112.00 (-11.81%) |
125.00 |
105.20 - 131.70 |
0.5543 times |
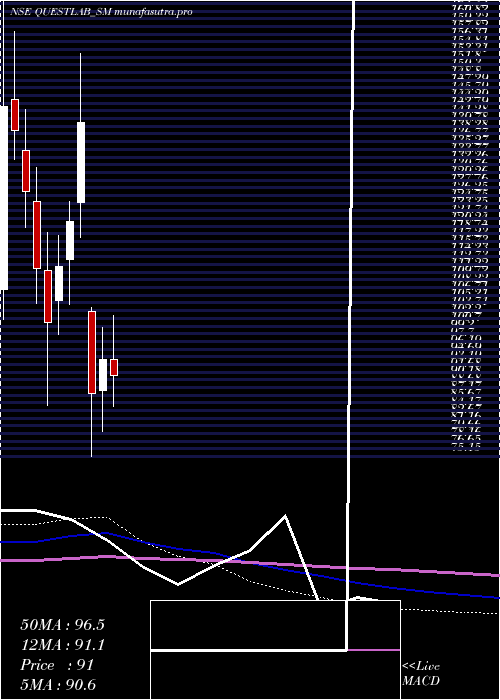
DMA SMA EMA moving averages of Quest Laboratories QUESTLAB_SM
DMA (daily moving average) of Quest Laboratories QUESTLAB_SM
| DMA period | DMA value | | 5 day DMA | 89.7 | | 12 day DMA | 88.57 | | 20 day DMA | 90 | | 35 day DMA | 93 | | 50 day DMA | 94.8 | | 100 day DMA | 94.26 | | 150 day DMA | 100.27 | | 200 day DMA | 103.27 | EMA (exponential moving average) of Quest Laboratories QUESTLAB_SM
| EMA period | EMA current | EMA prev | EMA prev2 | | 5 day EMA | 89.38 | 89.45 | 89.73 | | 12 day EMA | 89.5 | 89.54 | 89.66 | | 20 day EMA | 90.44 | 90.56 | 90.73 | | 35 day EMA | 92.36 | 92.54 | 92.75 | | 50 day EMA | 94.76 | 94.98 | 95.23 |
SMA (simple moving average) of Quest Laboratories QUESTLAB_SM
| SMA period | SMA current | SMA prev | SMA prev2 | | 5 day SMA | 89.7 | 89.45 | 89.27 | | 12 day SMA | 88.57 | 88.31 | 88.11 | | 20 day SMA | 90 | 90.32 | 90.72 | | 35 day SMA | 93 | 93.28 | 93.57 | | 50 day SMA | 94.8 | 95.04 | 95.26 | | 100 day SMA | 94.26 | 94.23 | 94.21 | | 150 day SMA | 100.27 | 100.34 | 100.45 | | 200 day SMA | 103.27 | 103.51 | 103.72 |
|
|
