QuantumGold QGOLDHALF full analysis,charts,indicators,moving averages,SMA,DMA,EMA,ADX,MACD,RSIQuantum Gold QGOLDHALF WideScreen charts, DMA,SMA,EMA technical analysis, forecast prediction, by indicators ADX,MACD,RSI,CCI NSE stock exchange
Daily price and charts and targets QuantumGold Strong Daily Stock price targets for QuantumGold QGOLDHALF are 93.8 and 98.28 | Daily Target 1 | 92.87 | | Daily Target 2 | 94.72 | | Daily Target 3 | 97.353333333333 | | Daily Target 4 | 99.2 | | Daily Target 5 | 101.83 |
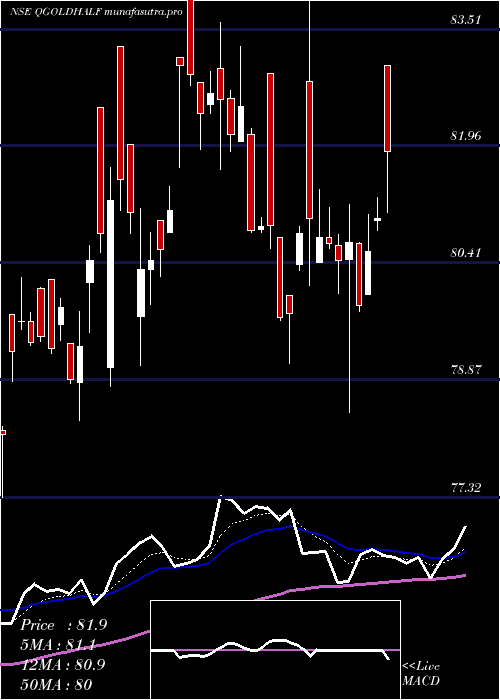
Daily price and volume Quantum Gold
| Date |
Closing |
Open |
Range |
Volume |
Tue 28 October 2025 |
96.56 (-3.67%) |
99.99 |
95.51 - 99.99 |
0.8345 times |
Mon 27 October 2025 |
100.24 (-0.06%) |
99.81 |
99.80 - 101.39 |
0.3886 times |
Fri 24 October 2025 |
100.30 (-1.3%) |
104.16 |
99.65 - 104.16 |
1.6886 times |
Thu 23 October 2025 |
101.62 (-4.2%) |
102.99 |
95.56 - 103.00 |
0.6359 times |
Tue 21 October 2025 |
106.07 (0.54%) |
108.13 |
105.48 - 109.22 |
0.0739 times |
Mon 20 October 2025 |
105.50 (-2.52%) |
108.00 |
104.49 - 108.00 |
1.6945 times |
Fri 17 October 2025 |
108.23 (2.67%) |
107.00 |
106.73 - 109.50 |
1.2781 times |
Thu 16 October 2025 |
105.42 (-0.07%) |
106.49 |
105.10 - 106.92 |
0.5987 times |
Wed 15 October 2025 |
105.49 (0.47%) |
106.78 |
105.23 - 106.79 |
1.5125 times |
Tue 14 October 2025 |
105.00 (2.19%) |
105.31 |
103.56 - 106.37 |
1.2947 times |
Mon 13 October 2025 |
102.75 (2.24%) |
103.01 |
101.13 - 104.60 |
1.4279 times |
Weekly price and charts QuantumGold Strong weekly Stock price targets for QuantumGold QGOLDHALF are 93.1 and 98.98 | Weekly Target 1 | 91.94 | | Weekly Target 2 | 94.25 | | Weekly Target 3 | 97.82 | | Weekly Target 4 | 100.13 | | Weekly Target 5 | 103.7 |
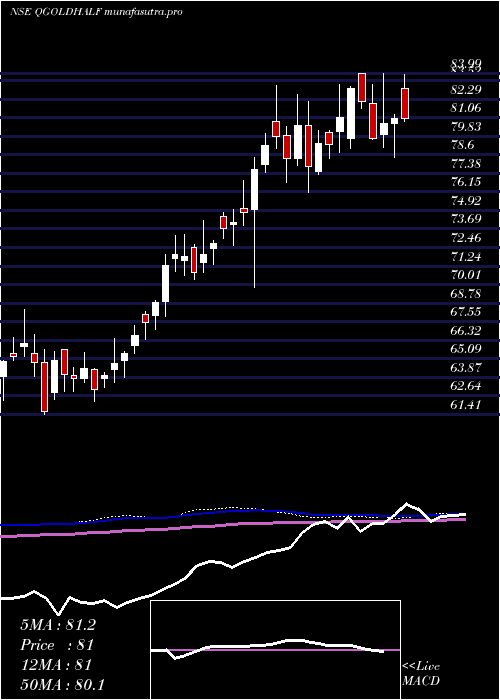
Weekly price and volumes for Quantum Gold
| Date |
Closing |
Open |
Range |
Volume |
Tue 28 October 2025 |
96.56 (-3.73%) |
99.81 |
95.51 - 101.39 |
0.3108 times |
Fri 24 October 2025 |
100.30 (-7.33%) |
108.00 |
95.56 - 109.22 |
1.0402 times |
Fri 17 October 2025 |
108.23 (7.69%) |
103.01 |
101.13 - 109.50 |
1.5533 times |
Fri 10 October 2025 |
100.50 (2.72%) |
100.28 |
97.94 - 103.03 |
1.91 times |
Fri 03 October 2025 |
97.84 (3.99%) |
95.99 |
93.31 - 102.46 |
0.9404 times |
Fri 26 September 2025 |
94.09 (3.1%) |
91.26 |
90.75 - 96.60 |
1.0479 times |
Fri 19 September 2025 |
91.26 (0.12%) |
93.42 |
90.62 - 94.44 |
1.0143 times |
Fri 12 September 2025 |
91.15 (2.79%) |
90.89 |
88.90 - 92.84 |
1.0486 times |
Fri 05 September 2025 |
88.68 (4.17%) |
85.93 |
85.93 - 90.69 |
0.8644 times |
Fri 29 August 2025 |
85.13 (3.15%) |
82.53 |
82.53 - 85.24 |
0.2702 times |
Fri 22 August 2025 |
82.53 (-0.46%) |
83.47 |
80.09 - 83.70 |
0.2968 times |
Monthly price and charts QuantumGold Strong monthly Stock price targets for QuantumGold QGOLDHALF are 94.94 and 111.13 | Monthly Target 1 | 83.6 | | Monthly Target 2 | 90.08 | | Monthly Target 3 | 99.79 | | Monthly Target 4 | 106.27 | | Monthly Target 5 | 115.98 |
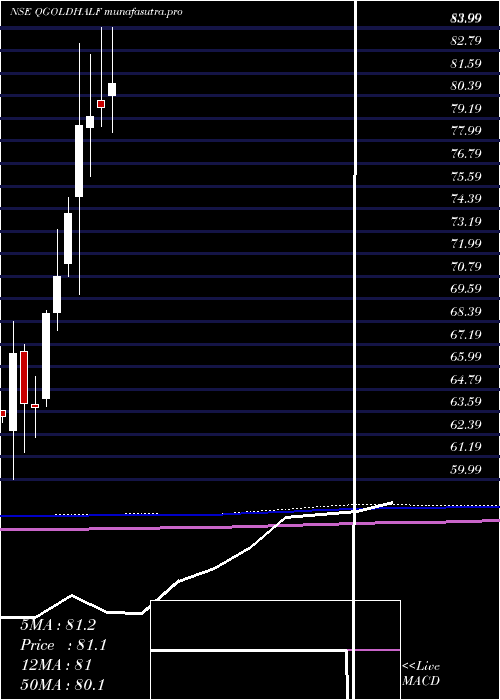
Monthly price and volumes Quantum Gold
| Date |
Closing |
Open |
Range |
Volume |
Tue 28 October 2025 |
96.56 (0.89%) |
93.31 |
93.31 - 109.50 |
2.2638 times |
Tue 30 September 2025 |
95.71 (12.43%) |
85.93 |
85.93 - 101.30 |
1.79 times |
Fri 29 August 2025 |
85.13 (3.7%) |
82.08 |
80.09 - 85.93 |
0.6767 times |
Thu 31 July 2025 |
82.09 (2.93%) |
80.40 |
78.43 - 83.99 |
0.9008 times |
Mon 30 June 2025 |
79.75 (0.57%) |
80.16 |
78.78 - 83.99 |
1.1027 times |
Fri 30 May 2025 |
79.30 (0.63%) |
78.70 |
76.11 - 82.60 |
0.849 times |
Wed 30 April 2025 |
78.80 (6.3%) |
75.03 |
69.80 - 83.18 |
0.9799 times |
Fri 28 March 2025 |
74.13 (4.7%) |
71.49 |
70.80 - 75.00 |
0.4283 times |
Fri 28 February 2025 |
70.80 (2.89%) |
68.89 |
67.89 - 73.29 |
0.2882 times |
Fri 31 January 2025 |
68.81 (7.85%) |
64.29 |
63.87 - 68.97 |
0.7205 times |
Tue 31 December 2024 |
63.80 (-0.39%) |
63.95 |
62.24 - 65.49 |
0.542 times |
DMA SMA EMA moving averages of Quantum Gold QGOLDHALF
DMA (daily moving average) of Quantum Gold QGOLDHALF
| DMA period | DMA value | | 5 day DMA | 100.96 | | 12 day DMA | 103.14 | | 20 day DMA | 101.39 | | 35 day DMA | 97.42 | | 50 day DMA | 93.57 | | 100 day DMA | 87.65 | | 150 day DMA | 84.43 | | 200 day DMA | 80.79 | EMA (exponential moving average) of Quantum Gold QGOLDHALF
| EMA period | EMA current | EMA prev | EMA prev2 | | 5 day EMA | 100.23 | 102.07 | 102.99 | | 12 day EMA | 101.43 | 102.31 | 102.69 | | 20 day EMA | 100.4 | 100.8 | 100.86 | | 35 day EMA | 97.27 | 97.31 | 97.14 | | 50 day EMA | 93.44 | 93.31 | 93.03 |
SMA (simple moving average) of Quantum Gold QGOLDHALF
| SMA period | SMA current | SMA prev | SMA prev2 | | 5 day SMA | 100.96 | 102.75 | 104.34 | | 12 day SMA | 103.14 | 103.57 | 103.71 | | 20 day SMA | 101.39 | 101.27 | 100.97 | | 35 day SMA | 97.42 | 97.2 | 96.85 | | 50 day SMA | 93.57 | 93.3 | 92.95 | | 100 day SMA | 87.65 | 87.5 | 87.31 | | 150 day SMA | 84.43 | 84.28 | 84.11 | | 200 day SMA | 80.79 | 80.63 | 80.45 |
|
|
