PyramidTechnoplast PYRAMID full analysis,charts,indicators,moving averages,SMA,DMA,EMA,ADX,MACD,RSIPyramid Technoplast PYRAMID WideScreen charts, DMA,SMA,EMA technical analysis, forecast prediction, by indicators ADX,MACD,RSI,CCI NSE stock exchange
Daily price and charts and targets PyramidTechnoplast Strong Daily Stock price targets for PyramidTechnoplast PYRAMID are 161.08 and 166.07 | Daily Target 1 | 157.06 | | Daily Target 2 | 160.11 | | Daily Target 3 | 162.05 | | Daily Target 4 | 165.1 | | Daily Target 5 | 167.04 |
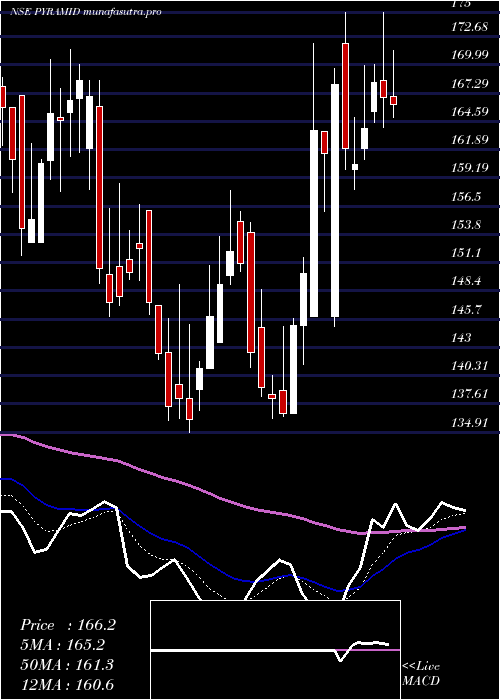
Daily price and volume Pyramid Technoplast
| Date |
Closing |
Open |
Range |
Volume |
Wed 29 October 2025 |
163.16 (2.8%) |
159.00 |
159.00 - 163.99 |
0.8785 times |
Tue 28 October 2025 |
158.72 (-1.12%) |
160.51 |
158.00 - 163.08 |
0.7542 times |
Mon 27 October 2025 |
160.51 (0.26%) |
160.89 |
160.02 - 162.60 |
0.3939 times |
Fri 24 October 2025 |
160.09 (-0.86%) |
158.05 |
158.05 - 162.99 |
0.5062 times |
Thu 23 October 2025 |
161.48 (0.36%) |
164.70 |
158.41 - 164.70 |
0.9959 times |
Tue 21 October 2025 |
160.90 (0.87%) |
158.05 |
158.05 - 161.95 |
0.3006 times |
Mon 20 October 2025 |
159.52 (-0.32%) |
159.23 |
158.00 - 164.99 |
1.1654 times |
Fri 17 October 2025 |
160.03 (0.72%) |
159.80 |
158.35 - 164.99 |
1.7648 times |
Thu 16 October 2025 |
158.89 (0.11%) |
165.40 |
158.25 - 165.40 |
1.7917 times |
Wed 15 October 2025 |
158.72 (1.2%) |
156.84 |
155.94 - 161.84 |
1.4488 times |
Tue 14 October 2025 |
156.84 (-3.02%) |
162.27 |
155.23 - 162.27 |
1.5367 times |
Weekly price and charts PyramidTechnoplast Strong weekly Stock price targets for PyramidTechnoplast PYRAMID are 160.58 and 166.57 | Weekly Target 1 | 155.73 | | Weekly Target 2 | 159.44 | | Weekly Target 3 | 161.71666666667 | | Weekly Target 4 | 165.43 | | Weekly Target 5 | 167.71 |
Weekly price and volumes for Pyramid Technoplast
| Date |
Closing |
Open |
Range |
Volume |
Wed 29 October 2025 |
163.16 (1.92%) |
160.89 |
158.00 - 163.99 |
0.3388 times |
Fri 24 October 2025 |
160.09 (0.04%) |
159.23 |
158.00 - 164.99 |
0.4962 times |
Fri 17 October 2025 |
160.03 (-2.5%) |
161.00 |
155.23 - 165.40 |
1.1859 times |
Fri 10 October 2025 |
164.13 (0.95%) |
160.25 |
160.00 - 167.40 |
0.664 times |
Fri 03 October 2025 |
162.58 (1.53%) |
164.00 |
154.65 - 164.50 |
0.5186 times |
Fri 26 September 2025 |
160.13 (-3.7%) |
164.25 |
159.05 - 170.40 |
0.7609 times |
Fri 19 September 2025 |
166.28 (-0.84%) |
170.20 |
164.29 - 172.64 |
1.2332 times |
Fri 12 September 2025 |
167.69 (-1.39%) |
170.00 |
166.64 - 179.46 |
1.8396 times |
Fri 05 September 2025 |
170.06 (4.61%) |
163.49 |
160.26 - 173.97 |
1.4673 times |
Fri 29 August 2025 |
162.56 (1.2%) |
161.61 |
158.01 - 165.90 |
1.4955 times |
Fri 22 August 2025 |
160.64 (4.61%) |
155.00 |
152.00 - 163.01 |
1.7924 times |

Monthly price and charts PyramidTechnoplast Strong monthly Stock price targets for PyramidTechnoplast PYRAMID are 159.2 and 171.37 | Monthly Target 1 | 149.76 | | Monthly Target 2 | 156.46 | | Monthly Target 3 | 161.93 | | Monthly Target 4 | 168.63 | | Monthly Target 5 | 174.1 |
Monthly price and volumes Pyramid Technoplast
| Date |
Closing |
Open |
Range |
Volume |
Wed 29 October 2025 |
163.16 (2.4%) |
159.33 |
155.23 - 167.40 |
0.3461 times |
Tue 30 September 2025 |
159.33 (-1.99%) |
163.49 |
154.65 - 179.46 |
0.6834 times |
Fri 29 August 2025 |
162.56 (-2.79%) |
165.15 |
148.25 - 174.00 |
0.8638 times |
Thu 31 July 2025 |
167.23 (-7.12%) |
178.12 |
157.05 - 185.38 |
0.7293 times |
Mon 30 June 2025 |
180.04 (2.89%) |
176.90 |
167.20 - 190.00 |
1.0583 times |
Fri 30 May 2025 |
174.99 (11.68%) |
159.43 |
152.00 - 179.00 |
0.9282 times |
Wed 30 April 2025 |
156.69 (14.64%) |
136.68 |
136.68 - 178.00 |
1.3853 times |
Fri 28 March 2025 |
136.68 (-18.14%) |
166.03 |
134.91 - 168.50 |
1.7938 times |
Fri 28 February 2025 |
166.97 (-7.88%) |
180.92 |
151.80 - 198.00 |
0.8943 times |
Fri 31 January 2025 |
181.25 (-12.58%) |
207.74 |
162.38 - 217.60 |
1.3175 times |
Tue 31 December 2024 |
207.34 (0.56%) |
204.11 |
197.55 - 236.95 |
3.0855 times |

DMA SMA EMA moving averages of Pyramid Technoplast PYRAMID
DMA (daily moving average) of Pyramid Technoplast PYRAMID
| DMA period | DMA value | | 5 day DMA | 160.79 | | 12 day DMA | 160.05 | | 20 day DMA | 161.3 | | 35 day DMA | 163.72 | | 50 day DMA | 163.79 | | 100 day DMA | 168.03 | | 150 day DMA | 165.48 | | 200 day DMA | 166.12 | EMA (exponential moving average) of Pyramid Technoplast PYRAMID
| EMA period | EMA current | EMA prev | EMA prev2 | | 5 day EMA | 160.97 | 159.87 | 160.45 | | 12 day EMA | 160.92 | 160.51 | 160.83 | | 20 day EMA | 161.4 | 161.21 | 161.47 | | 35 day EMA | 162.09 | 162.03 | 162.23 | | 50 day EMA | 162.98 | 162.97 | 163.14 |
SMA (simple moving average) of Pyramid Technoplast PYRAMID
| SMA period | SMA current | SMA prev | SMA prev2 | | 5 day SMA | 160.79 | 160.34 | 160.5 | | 12 day SMA | 160.05 | 160.13 | 160.58 | | 20 day SMA | 161.3 | 160.96 | 161.03 | | 35 day SMA | 163.72 | 164.09 | 164.41 | | 50 day SMA | 163.79 | 163.6 | 163.55 | | 100 day SMA | 168.03 | 168.09 | 168.21 | | 150 day SMA | 165.48 | 165.39 | 165.3 | | 200 day SMA | 166.12 | 166.3 | 166.49 |
|
|
