PunjabChemicals PUNJABCHEM full analysis,charts,indicators,moving averages,SMA,DMA,EMA,ADX,MACD,RSIPunjab Chemicals PUNJABCHEM WideScreen charts, DMA,SMA,EMA technical analysis, forecast prediction, by indicators ADX,MACD,RSI,CCI NSE stock exchange
operates under Agrochemicals sector
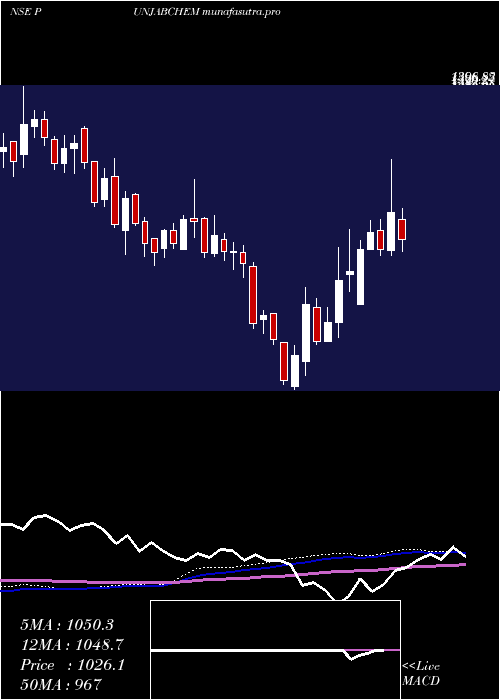
Daily price and charts and targets PunjabChemicals Strong Daily Stock price targets for PunjabChemicals PUNJABCHEM are 1387 and 1450.8 | Daily Target 1 | 1335.87 | | Daily Target 2 | 1374.33 | | Daily Target 3 | 1399.6666666667 | | Daily Target 4 | 1438.13 | | Daily Target 5 | 1463.47 |
Daily price and volume Punjab Chemicals
| Date |
Closing |
Open |
Range |
Volume |
Mon 27 October 2025 |
1412.80 (2.47%) |
1382.30 |
1361.20 - 1425.00 |
0.5519 times |
Fri 24 October 2025 |
1378.70 (2.17%) |
1357.00 |
1351.20 - 1394.90 |
0.6815 times |
Thu 23 October 2025 |
1349.40 (-0.01%) |
1356.70 |
1341.00 - 1365.00 |
0.2487 times |
Tue 21 October 2025 |
1349.60 (-0.63%) |
1373.50 |
1345.00 - 1374.00 |
0.1082 times |
Mon 20 October 2025 |
1358.20 (1.04%) |
1344.20 |
1342.00 - 1370.30 |
0.4102 times |
Fri 17 October 2025 |
1344.20 (-4.31%) |
1405.20 |
1337.00 - 1407.50 |
1.116 times |
Thu 16 October 2025 |
1404.70 (4.35%) |
1334.00 |
1334.00 - 1459.00 |
5.2934 times |
Wed 15 October 2025 |
1346.20 (-0.27%) |
1349.80 |
1325.00 - 1358.10 |
0.4196 times |
Tue 14 October 2025 |
1349.80 (0.85%) |
1341.10 |
1320.30 - 1375.00 |
0.758 times |
Mon 13 October 2025 |
1338.40 (0.87%) |
1329.50 |
1303.10 - 1341.00 |
0.4125 times |
Fri 10 October 2025 |
1326.80 (2.53%) |
1299.30 |
1290.60 - 1332.60 |
0.4605 times |
Weekly price and charts PunjabChemicals Strong weekly Stock price targets for PunjabChemicals PUNJABCHEM are 1387 and 1450.8 | Weekly Target 1 | 1335.87 | | Weekly Target 2 | 1374.33 | | Weekly Target 3 | 1399.6666666667 | | Weekly Target 4 | 1438.13 | | Weekly Target 5 | 1463.47 |
Weekly price and volumes for Punjab Chemicals
| Date |
Closing |
Open |
Range |
Volume |
Mon 27 October 2025 |
1412.80 (2.47%) |
1382.30 |
1361.20 - 1425.00 |
0.0593 times |
Fri 24 October 2025 |
1378.70 (2.57%) |
1344.20 |
1341.00 - 1394.90 |
0.1556 times |
Fri 17 October 2025 |
1344.20 (1.31%) |
1329.50 |
1303.10 - 1459.00 |
0.8593 times |
Fri 10 October 2025 |
1326.80 (0.68%) |
1317.90 |
1290.30 - 1361.50 |
0.2842 times |
Fri 03 October 2025 |
1317.90 (3.7%) |
1277.20 |
1272.60 - 1403.00 |
0.4082 times |
Fri 26 September 2025 |
1270.90 (-2.15%) |
1310.00 |
1223.80 - 1344.90 |
0.4904 times |
Fri 19 September 2025 |
1298.80 (3.37%) |
1243.20 |
1214.40 - 1331.00 |
1.0703 times |
Fri 12 September 2025 |
1256.50 (12.95%) |
1115.00 |
1070.90 - 1298.00 |
5.804 times |
Fri 05 September 2025 |
1112.40 (-4.55%) |
1170.10 |
1105.10 - 1189.40 |
0.351 times |
Fri 29 August 2025 |
1165.40 (-3.18%) |
1215.70 |
1125.10 - 1218.40 |
0.5177 times |
Fri 22 August 2025 |
1203.70 (-2.31%) |
1239.90 |
1186.00 - 1265.30 |
0.918 times |
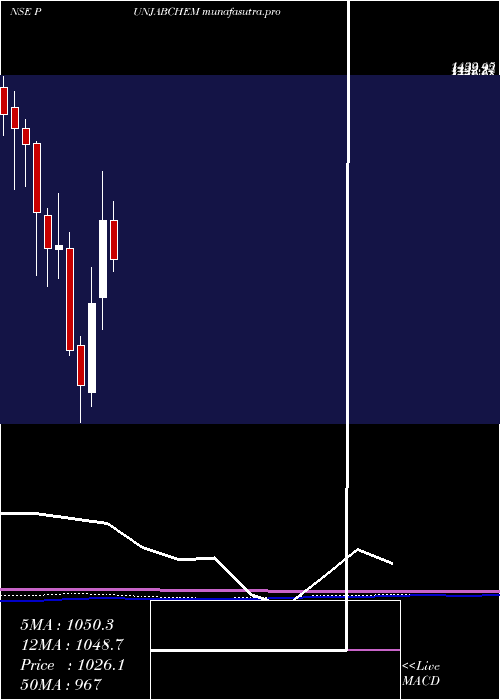
Monthly price and charts PunjabChemicals Strong monthly Stock price targets for PunjabChemicals PUNJABCHEM are 1351.55 and 1520.25 | Monthly Target 1 | 1218.67 | | Monthly Target 2 | 1315.73 | | Monthly Target 3 | 1387.3666666667 | | Monthly Target 4 | 1484.43 | | Monthly Target 5 | 1556.07 |
Monthly price and volumes Punjab Chemicals
| Date |
Closing |
Open |
Range |
Volume |
Mon 27 October 2025 |
1412.80 (4.22%) |
1360.10 |
1290.30 - 1459.00 |
0.2825 times |
Tue 30 September 2025 |
1355.60 (16.32%) |
1170.10 |
1070.90 - 1375.00 |
1.5074 times |
Fri 29 August 2025 |
1165.40 (-19.63%) |
1469.00 |
1125.10 - 1536.00 |
0.9363 times |
Thu 31 July 2025 |
1450.00 (13.8%) |
1270.00 |
1146.10 - 1666.00 |
3.7536 times |
Mon 30 June 2025 |
1274.20 (7.44%) |
1175.20 |
1040.10 - 1280.10 |
0.407 times |
Fri 30 May 2025 |
1186.00 (6.61%) |
1112.00 |
998.00 - 1224.70 |
0.4134 times |
Wed 30 April 2025 |
1112.50 (20.02%) |
940.90 |
870.05 - 1219.90 |
0.9678 times |
Fri 28 March 2025 |
926.95 (24.35%) |
730.40 |
698.00 - 1006.80 |
1.3903 times |
Fri 28 February 2025 |
745.45 (-9.33%) |
833.50 |
662.00 - 855.00 |
0.2226 times |
Fri 31 January 2025 |
822.15 (-22.1%) |
1050.00 |
812.00 - 1084.00 |
0.1192 times |
Tue 31 December 2024 |
1055.45 (0.59%) |
1048.00 |
983.85 - 1172.00 |
0.1877 times |
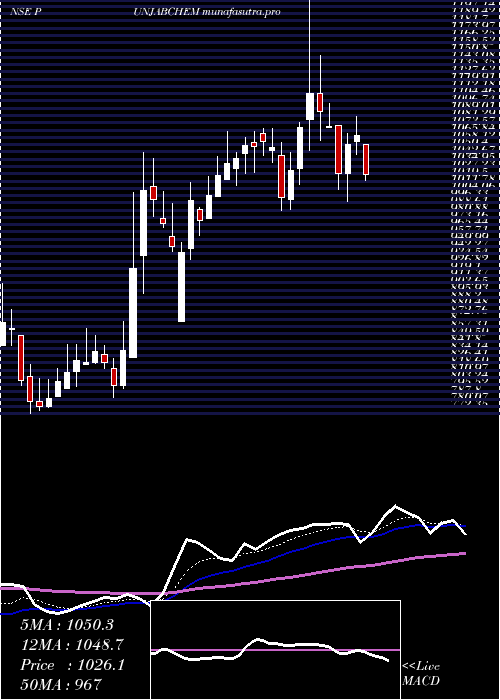
DMA SMA EMA moving averages of Punjab Chemicals PUNJABCHEM
DMA (daily moving average) of Punjab Chemicals PUNJABCHEM
| DMA period | DMA value | | 5 day DMA | 1369.74 | | 12 day DMA | 1354.41 | | 20 day DMA | 1340.17 | | 35 day DMA | 1285.43 | | 50 day DMA | 1256.52 | | 100 day DMA | 1249.75 | | 150 day DMA | 1176.48 | | 200 day DMA | 1094.62 | EMA (exponential moving average) of Punjab Chemicals PUNJABCHEM
| EMA period | EMA current | EMA prev | EMA prev2 | | 5 day EMA | 1378.27 | 1361.01 | 1352.16 | | 12 day EMA | 1357.15 | 1347.04 | 1341.29 | | 20 day EMA | 1337.29 | 1329.35 | 1324.16 | | 35 day EMA | 1305.99 | 1299.7 | 1295.05 | | 50 day EMA | 1272.31 | 1266.58 | 1262.01 |
SMA (simple moving average) of Punjab Chemicals PUNJABCHEM
| SMA period | SMA current | SMA prev | SMA prev2 | | 5 day SMA | 1369.74 | 1356.02 | 1361.22 | | 12 day SMA | 1354.41 | 1346.31 | 1341.03 | | 20 day SMA | 1340.17 | 1333.04 | 1326.16 | | 35 day SMA | 1285.43 | 1277.35 | 1271.6 | | 50 day SMA | 1256.52 | 1253.63 | 1252.2 | | 100 day SMA | 1249.75 | 1246.85 | 1244.46 | | 150 day SMA | 1176.48 | 1172.44 | 1168.5 | | 200 day SMA | 1094.62 | 1092.74 | 1091.14 |
|
|
