PtcIndustries PTCIL full analysis,charts,indicators,moving averages,SMA,DMA,EMA,ADX,MACD,RSIPtc Industries PTCIL WideScreen charts, DMA,SMA,EMA technical analysis, forecast prediction, by indicators ADX,MACD,RSI,CCI NSE stock exchange
Daily price and charts and targets PtcIndustries Strong Daily Stock price targets for PtcIndustries PTCIL are 16875.5 and 17355.5 | Daily Target 1 | 16787 | | Daily Target 2 | 16964 | | Daily Target 3 | 17267 | | Daily Target 4 | 17444 | | Daily Target 5 | 17747 |
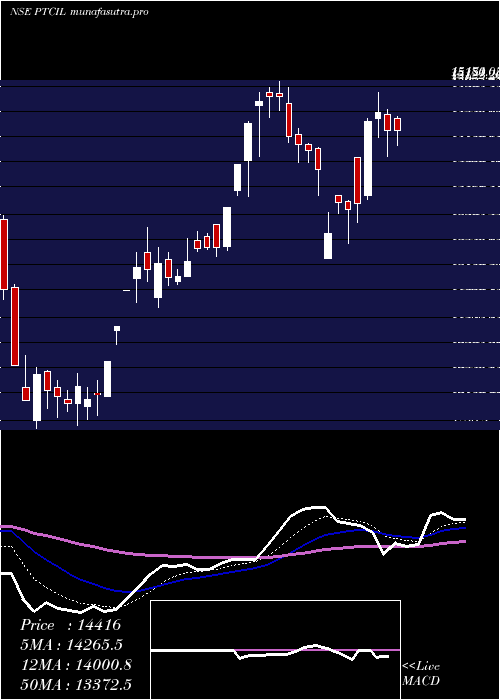
Daily price and volume Ptc Industries
| Date |
Closing |
Open |
Range |
Volume |
Tue 28 October 2025 |
17141.00 (-1.83%) |
17570.00 |
17090.00 - 17570.00 |
0.8033 times |
Mon 27 October 2025 |
17461.00 (2.77%) |
17300.00 |
17153.00 - 17900.00 |
2.7053 times |
Fri 24 October 2025 |
16990.00 (0.5%) |
16905.00 |
16821.00 - 17126.00 |
0.695 times |
Thu 23 October 2025 |
16905.00 (-0.66%) |
17017.00 |
16649.00 - 17134.00 |
0.8724 times |
Tue 21 October 2025 |
17017.00 (1.11%) |
17050.00 |
16980.00 - 17177.00 |
0.1864 times |
Mon 20 October 2025 |
16831.00 (0.42%) |
16951.00 |
16670.00 - 17390.00 |
1.5202 times |
Fri 17 October 2025 |
16760.00 (0.48%) |
16629.00 |
16401.00 - 16893.00 |
0.9954 times |
Thu 16 October 2025 |
16680.00 (-0.86%) |
16802.00 |
16600.00 - 16818.00 |
0.4029 times |
Wed 15 October 2025 |
16825.00 (1.61%) |
16401.00 |
16401.00 - 16990.00 |
1.044 times |
Tue 14 October 2025 |
16558.00 (0.82%) |
16424.00 |
16211.00 - 16640.00 |
0.7752 times |
Mon 13 October 2025 |
16424.00 (1.09%) |
16293.00 |
15870.00 - 16485.00 |
1.1697 times |
Weekly price and charts PtcIndustries Strong weekly Stock price targets for PtcIndustries PTCIL are 16710.5 and 17520.5 | Weekly Target 1 | 16567 | | Weekly Target 2 | 16854 | | Weekly Target 3 | 17377 | | Weekly Target 4 | 17664 | | Weekly Target 5 | 18187 |
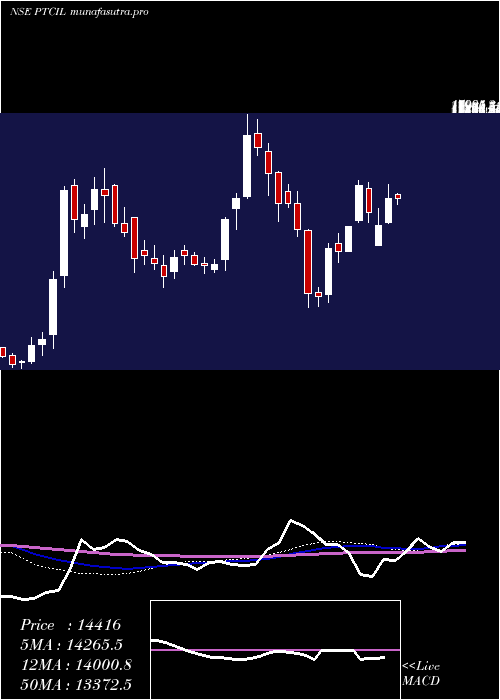
Weekly price and volumes for Ptc Industries
| Date |
Closing |
Open |
Range |
Volume |
Tue 28 October 2025 |
17141.00 (0.89%) |
17300.00 |
17090.00 - 17900.00 |
0.6709 times |
Fri 24 October 2025 |
16990.00 (1.37%) |
16951.00 |
16649.00 - 17390.00 |
0.626 times |
Fri 17 October 2025 |
16760.00 (3.16%) |
16293.00 |
15870.00 - 16990.00 |
0.8389 times |
Fri 10 October 2025 |
16247.00 (-2.41%) |
16849.00 |
15550.00 - 17038.00 |
1.4407 times |
Fri 03 October 2025 |
16648.00 (9.17%) |
15335.00 |
15015.00 - 17149.00 |
1.8708 times |
Fri 26 September 2025 |
15249.00 (2.05%) |
14942.00 |
14805.00 - 15945.00 |
1.0321 times |
Fri 19 September 2025 |
14942.00 (5.48%) |
14166.00 |
14039.00 - 15580.00 |
1.6163 times |
Fri 12 September 2025 |
14166.00 (4.29%) |
13750.00 |
13460.00 - 14525.00 |
0.7313 times |
Fri 05 September 2025 |
13583.00 (-3.05%) |
14014.00 |
13400.00 - 14078.00 |
0.4798 times |
Fri 29 August 2025 |
14011.00 (1.79%) |
13812.00 |
13664.00 - 14295.00 |
0.6933 times |
Fri 22 August 2025 |
13764.00 (0.24%) |
13731.00 |
13251.00 - 14577.00 |
2.4051 times |
Monthly price and charts PtcIndustries Strong monthly Stock price targets for PtcIndustries PTCIL are 16216.5 and 18824.5 | Monthly Target 1 | 14169.67 | | Monthly Target 2 | 15655.33 | | Monthly Target 3 | 16777.666666667 | | Monthly Target 4 | 18263.33 | | Monthly Target 5 | 19385.67 |
Monthly price and volumes Ptc Industries
| Date |
Closing |
Open |
Range |
Volume |
Tue 28 October 2025 |
17141.00 (10.39%) |
15292.00 |
15292.00 - 17900.00 |
1.1341 times |
Tue 30 September 2025 |
15528.00 (10.83%) |
14014.00 |
13400.00 - 15945.00 |
0.9082 times |
Fri 29 August 2025 |
14011.00 (-6.12%) |
14900.00 |
13251.00 - 15195.00 |
1.0201 times |
Thu 31 July 2025 |
14925.00 (-4.14%) |
15674.00 |
13970.00 - 15818.00 |
0.8212 times |
Mon 30 June 2025 |
15569.00 (1.76%) |
15300.00 |
13862.00 - 15850.00 |
1.2676 times |
Fri 30 May 2025 |
15299.00 (19.58%) |
12721.00 |
11902.00 - 15900.00 |
1.2108 times |
Wed 30 April 2025 |
12794.00 (-14.39%) |
14841.00 |
12417.55 - 15076.45 |
0.5024 times |
Fri 28 March 2025 |
14944.65 (46.45%) |
10298.00 |
9950.00 - 15180.00 |
0.7398 times |
Fri 28 February 2025 |
10204.80 (-28.15%) |
14700.00 |
9756.30 - 14998.95 |
0.8313 times |
Fri 31 January 2025 |
14203.45 (5.53%) |
13249.50 |
13201.00 - 17995.00 |
1.5643 times |
Tue 31 December 2024 |
13458.60 (12.45%) |
11968.60 |
11184.00 - 13999.70 |
1.0926 times |

DMA SMA EMA moving averages of Ptc Industries PTCIL
DMA (daily moving average) of Ptc Industries PTCIL
| DMA period | DMA value | | 5 day DMA | 17102.8 | | 12 day DMA | 16819.92 | | 20 day DMA | 16507.2 | | 35 day DMA | 15745.49 | | 50 day DMA | 15150.14 | | 100 day DMA | 14946.06 | | 150 day DMA | 14643.35 | | 200 day DMA | 14394.08 | EMA (exponential moving average) of Ptc Industries PTCIL
| EMA period | EMA current | EMA prev | EMA prev2 | | 5 day EMA | 17100.84 | 17080.77 | 16890.69 | | 12 day EMA | 16820.66 | 16762.44 | 16635.48 | | 20 day EMA | 16488.07 | 16419.37 | 16309.77 | | 35 day EMA | 15905 | 15832.23 | 15736.34 | | 50 day EMA | 15295.29 | 15219.99 | 15128.56 |
SMA (simple moving average) of Ptc Industries PTCIL
| SMA period | SMA current | SMA prev | SMA prev2 | | 5 day SMA | 17102.8 | 17040.8 | 16900.6 | | 12 day SMA | 16819.92 | 16781.17 | 16656.75 | | 20 day SMA | 16507.2 | 16412.6 | 16313.85 | | 35 day SMA | 15745.49 | 15643.83 | 15536 | | 50 day SMA | 15150.14 | 15091.02 | 15025.6 | | 100 day SMA | 14946.06 | 14922.22 | 14900.25 | | 150 day SMA | 14643.35 | 14612.98 | 14580.37 | | 200 day SMA | 14394.08 | 14386.61 | 14371.32 |
|
|
