PtcIndia PTC full analysis,charts,indicators,moving averages,SMA,DMA,EMA,ADX,MACD,RSIPtc India PTC WideScreen charts, DMA,SMA,EMA technical analysis, forecast prediction, by indicators ADX,MACD,RSI,CCI NSE stock exchange
operates under Electric Utilities sector
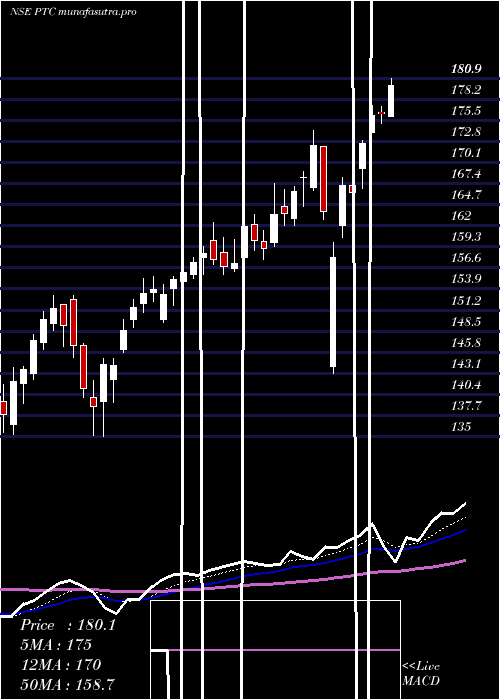
Daily price and charts and targets PtcIndia Strong Daily Stock price targets for PtcIndia PTC are 168.87 and 171.51 | Daily Target 1 | 168.14 | | Daily Target 2 | 169.59 | | Daily Target 3 | 170.78333333333 | | Daily Target 4 | 172.23 | | Daily Target 5 | 173.42 |
Daily price and volume Ptc India
| Date |
Closing |
Open |
Range |
Volume |
Tue 28 October 2025 |
171.03 (0.25%) |
171.98 |
169.34 - 171.98 |
0.9387 times |
Mon 27 October 2025 |
170.61 (2.62%) |
167.00 |
165.76 - 172.28 |
2.0554 times |
Fri 24 October 2025 |
166.25 (0.44%) |
166.50 |
165.55 - 167.50 |
1.194 times |
Thu 23 October 2025 |
165.52 (-0.08%) |
166.47 |
164.20 - 166.50 |
0.6595 times |
Tue 21 October 2025 |
165.65 (1.5%) |
163.21 |
163.21 - 165.89 |
0.1111 times |
Mon 20 October 2025 |
163.21 (-0.5%) |
164.50 |
161.01 - 164.94 |
0.9788 times |
Fri 17 October 2025 |
164.03 (-0.84%) |
165.60 |
163.10 - 166.48 |
1.8111 times |
Thu 16 October 2025 |
165.42 (0.54%) |
165.00 |
164.41 - 166.44 |
0.6826 times |
Wed 15 October 2025 |
164.53 (0.09%) |
164.41 |
163.80 - 165.10 |
0.8068 times |
Tue 14 October 2025 |
164.38 (-0.09%) |
165.00 |
163.18 - 165.71 |
0.762 times |
Mon 13 October 2025 |
164.53 (-0.11%) |
165.00 |
163.26 - 165.36 |
0.8071 times |
Weekly price and charts PtcIndia Strong weekly Stock price targets for PtcIndia PTC are 168.4 and 174.92 | Weekly Target 1 | 163.17 | | Weekly Target 2 | 167.1 | | Weekly Target 3 | 169.69 | | Weekly Target 4 | 173.62 | | Weekly Target 5 | 176.21 |
Weekly price and volumes for Ptc India
| Date |
Closing |
Open |
Range |
Volume |
Tue 28 October 2025 |
171.03 (2.88%) |
167.00 |
165.76 - 172.28 |
0.9574 times |
Fri 24 October 2025 |
166.25 (1.35%) |
164.50 |
161.01 - 167.50 |
0.9412 times |
Fri 17 October 2025 |
164.03 (-0.41%) |
165.00 |
163.10 - 166.48 |
1.5571 times |
Fri 10 October 2025 |
164.71 (-2.54%) |
170.50 |
164.00 - 170.50 |
1.0123 times |
Fri 03 October 2025 |
169.00 (1.12%) |
166.75 |
164.00 - 169.50 |
1.0344 times |
Fri 26 September 2025 |
167.13 (-4.34%) |
174.75 |
166.78 - 175.50 |
1.0958 times |
Fri 19 September 2025 |
174.72 (-0.16%) |
175.80 |
172.50 - 176.88 |
0.9338 times |
Fri 12 September 2025 |
175.00 (-0.36%) |
175.71 |
174.11 - 177.56 |
0.6601 times |
Fri 05 September 2025 |
175.64 (0.3%) |
176.50 |
173.60 - 181.95 |
0.8899 times |
Fri 29 August 2025 |
175.11 (-6.74%) |
187.76 |
174.25 - 190.49 |
0.918 times |
Fri 22 August 2025 |
187.76 (0.68%) |
186.79 |
184.25 - 192.50 |
0.9997 times |

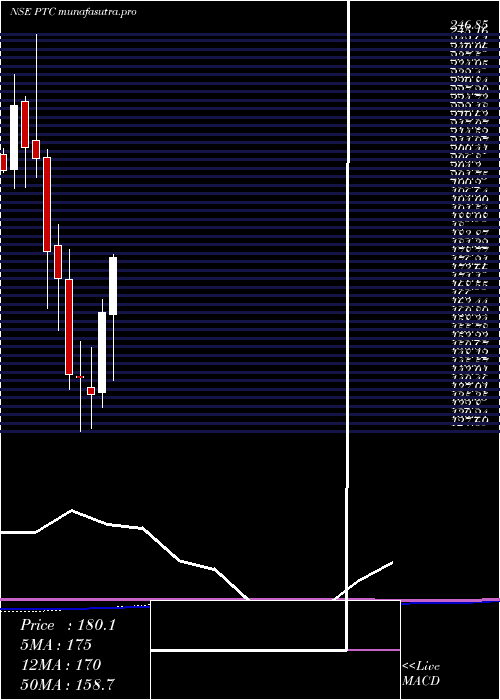
Monthly price and charts PtcIndia Strong monthly Stock price targets for PtcIndia PTC are 166.02 and 177.29 | Monthly Target 1 | 156.84 | | Monthly Target 2 | 163.93 | | Monthly Target 3 | 168.10666666667 | | Monthly Target 4 | 175.2 | | Monthly Target 5 | 179.38 |
Monthly price and volumes Ptc India
| Date |
Closing |
Open |
Range |
Volume |
Tue 28 October 2025 |
171.03 (2.71%) |
167.34 |
161.01 - 172.28 |
0.7071 times |
Tue 30 September 2025 |
166.52 (-4.91%) |
176.50 |
164.00 - 181.95 |
0.6313 times |
Fri 29 August 2025 |
175.11 (-8.75%) |
184.70 |
171.10 - 192.50 |
0.7686 times |
Thu 31 July 2025 |
191.90 (6.38%) |
181.03 |
178.25 - 207.00 |
1.4243 times |
Mon 30 June 2025 |
180.39 (2.41%) |
176.14 |
168.26 - 183.30 |
0.8567 times |
Fri 30 May 2025 |
176.14 (-0.23%) |
178.05 |
166.10 - 189.80 |
0.8489 times |
Wed 30 April 2025 |
176.55 (7.91%) |
163.00 |
143.01 - 187.22 |
0.9304 times |
Fri 28 March 2025 |
163.61 (17.86%) |
139.50 |
135.00 - 167.50 |
1.3091 times |
Fri 28 February 2025 |
138.82 (-3.58%) |
141.00 |
128.80 - 153.04 |
1.2045 times |
Fri 31 January 2025 |
143.98 (-0.69%) |
144.26 |
127.69 - 154.70 |
1.319 times |
Tue 31 December 2024 |
144.98 (-16.51%) |
173.50 |
140.35 - 182.45 |
1.3216 times |
DMA SMA EMA moving averages of Ptc India PTC
DMA (daily moving average) of Ptc India PTC
| DMA period | DMA value | | 5 day DMA | 167.81 | | 12 day DMA | 165.82 | | 20 day DMA | 166.15 | | 35 day DMA | 169.4 | | 50 day DMA | 173.38 | | 100 day DMA | 177.59 | | 150 day DMA | 176.75 | | 200 day DMA | 168.49 | EMA (exponential moving average) of Ptc India PTC
| EMA period | EMA current | EMA prev | EMA prev2 | | 5 day EMA | 168.43 | 167.13 | 165.39 | | 12 day EMA | 167.1 | 166.38 | 165.61 | | 20 day EMA | 167.63 | 167.27 | 166.92 | | 35 day EMA | 170.24 | 170.19 | 170.17 | | 50 day EMA | 173.53 | 173.63 | 173.75 |
SMA (simple moving average) of Ptc India PTC
| SMA period | SMA current | SMA prev | SMA prev2 | | 5 day SMA | 167.81 | 166.25 | 164.93 | | 12 day SMA | 165.82 | 165.3 | 164.86 | | 20 day SMA | 166.15 | 165.95 | 165.9 | | 35 day SMA | 169.4 | 169.53 | 169.69 | | 50 day SMA | 173.38 | 173.73 | 174.04 | | 100 day SMA | 177.59 | 177.62 | 177.66 | | 150 day SMA | 176.75 | 176.66 | 176.58 | | 200 day SMA | 168.49 | 168.34 | 168.25 |
|
|
