GoldmanSachs PSUBNKBEES full analysis,charts,indicators,moving averages,SMA,DMA,EMA,ADX,MACD,RSIGoldman Sachs PSUBNKBEES WideScreen charts, DMA,SMA,EMA technical analysis, forecast prediction, by indicators ADX,MACD,RSI,CCI NSE stock exchange
Daily price and charts and targets GoldmanSachs Strong Daily Stock price targets for GoldmanSachs PSUBNKBEES are 89.85 and 91.95 | Daily Target 1 | 89.36 | | Daily Target 2 | 90.33 | | Daily Target 3 | 91.463333333333 | | Daily Target 4 | 92.43 | | Daily Target 5 | 93.56 |
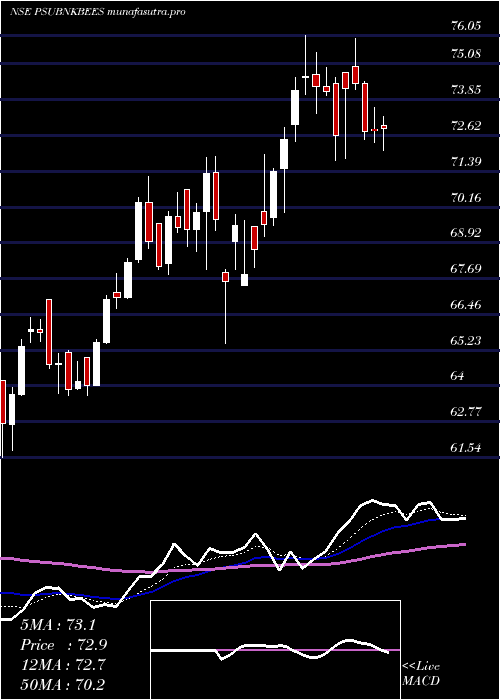
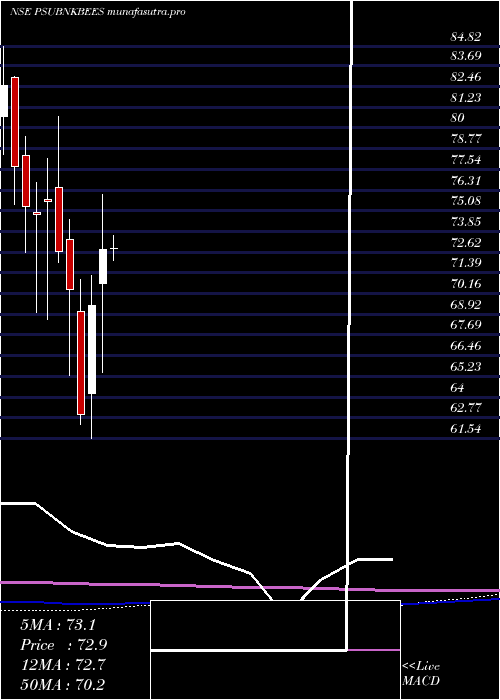
Daily price and volume Goldman Sachs
| Date |
Closing |
Open |
Range |
Volume |
Wed 10 December 2025 |
91.29 (-0.87%) |
92.09 |
90.50 - 92.60 |
0.5111 times |
Tue 09 December 2025 |
92.09 (1.39%) |
91.37 |
89.70 - 92.40 |
1.3302 times |
Mon 08 December 2025 |
90.83 (-2.79%) |
93.63 |
90.32 - 93.64 |
1.2487 times |
Fri 05 December 2025 |
93.44 (1.53%) |
92.85 |
91.82 - 93.55 |
0.7759 times |
Thu 04 December 2025 |
92.03 (-0.05%) |
92.85 |
91.52 - 92.85 |
0.6475 times |
Wed 03 December 2025 |
92.08 (-3.08%) |
95.97 |
91.60 - 95.98 |
1.8044 times |
Tue 02 December 2025 |
95.01 (-0.28%) |
97.66 |
94.86 - 97.66 |
1.1004 times |
Mon 01 December 2025 |
95.28 (0.28%) |
95.01 |
94.81 - 95.95 |
1.0139 times |
Fri 28 November 2025 |
95.01 (0.16%) |
95.00 |
94.50 - 95.33 |
0.5642 times |
Thu 27 November 2025 |
94.86 (-0.59%) |
95.61 |
94.40 - 95.96 |
1.0036 times |
Wed 26 November 2025 |
95.42 (0.75%) |
95.00 |
94.76 - 96.55 |
1.1753 times |
Weekly price and charts GoldmanSachs Strong weekly Stock price targets for GoldmanSachs PSUBNKBEES are 88.53 and 92.47 | Weekly Target 1 | 87.6 | | Weekly Target 2 | 89.45 | | Weekly Target 3 | 91.543333333333 | | Weekly Target 4 | 93.39 | | Weekly Target 5 | 95.48 |
Weekly price and volumes for Goldman Sachs
| Date |
Closing |
Open |
Range |
Volume |
Wed 10 December 2025 |
91.29 (-2.3%) |
93.63 |
89.70 - 93.64 |
0.7232 times |
Fri 05 December 2025 |
93.44 (-1.65%) |
95.01 |
91.52 - 97.66 |
1.2503 times |
Fri 28 November 2025 |
95.01 (1.93%) |
93.60 |
92.88 - 96.55 |
0.9464 times |
Fri 21 November 2025 |
93.21 (-0.54%) |
93.89 |
93.08 - 96.59 |
1.5756 times |
Fri 14 November 2025 |
93.72 (0.68%) |
90.76 |
90.76 - 93.99 |
0.7641 times |
Fri 07 November 2025 |
93.09 (1.99%) |
91.39 |
90.76 - 94.10 |
1.0379 times |
Fri 31 October 2025 |
91.27 (4.64%) |
87.30 |
87.23 - 92.27 |
1.3442 times |
Fri 24 October 2025 |
87.22 (2.44%) |
85.72 |
85.40 - 88.99 |
0.828 times |
Fri 17 October 2025 |
85.14 (-0.8%) |
85.83 |
84.52 - 86.95 |
0.8458 times |
Fri 10 October 2025 |
85.83 (1.38%) |
84.66 |
83.32 - 86.13 |
0.6844 times |
Fri 03 October 2025 |
84.66 (4.53%) |
80.25 |
80.25 - 84.85 |
0.7854 times |

Monthly price and charts GoldmanSachs Strong monthly Stock price targets for GoldmanSachs PSUBNKBEES are 86.52 and 94.48 | Monthly Target 1 | 84.92 | | Monthly Target 2 | 88.11 | | Monthly Target 3 | 92.883333333333 | | Monthly Target 4 | 96.07 | | Monthly Target 5 | 100.84 |
Monthly price and volumes Goldman Sachs
| Date |
Closing |
Open |
Range |
Volume |
Wed 10 December 2025 |
91.29 (-3.92%) |
95.01 |
89.70 - 97.66 |
0.5636 times |
Fri 28 November 2025 |
95.01 (4.1%) |
91.39 |
90.76 - 96.59 |
1.2348 times |
Fri 31 October 2025 |
91.27 (8.73%) |
83.05 |
82.80 - 92.27 |
1.1676 times |
Tue 30 September 2025 |
83.94 (11.61%) |
76.40 |
74.31 - 84.41 |
0.8137 times |
Fri 29 August 2025 |
75.21 (-1.74%) |
76.57 |
73.82 - 80.60 |
0.5605 times |
Thu 31 July 2025 |
76.54 (-4.91%) |
80.50 |
75.35 - 83.15 |
0.9517 times |
Mon 30 June 2025 |
80.49 (3.06%) |
78.10 |
74.44 - 81.92 |
1.6021 times |
Fri 30 May 2025 |
78.10 (7.32%) |
72.84 |
66.59 - 78.58 |
1.1072 times |
Wed 30 April 2025 |
72.77 (4.8%) |
70.75 |
65.48 - 76.05 |
1.0821 times |
Fri 28 March 2025 |
69.44 (10.27%) |
64.19 |
61.54 - 71.21 |
0.9168 times |
Fri 28 February 2025 |
62.97 (-10.57%) |
69.09 |
62.37 - 70.99 |
0.7028 times |
DMA SMA EMA moving averages of Goldman Sachs PSUBNKBEES
DMA (daily moving average) of Goldman Sachs PSUBNKBEES
| DMA period | DMA value | | 5 day DMA | 91.94 | | 12 day DMA | 93.5 | | 20 day DMA | 93.72 | | 35 day DMA | 92.54 | | 50 day DMA | 90.25 | | 100 day DMA | 84.34 | | 150 day DMA | 81.93 | | 200 day DMA | 78.58 | EMA (exponential moving average) of Goldman Sachs PSUBNKBEES
| EMA period | EMA current | EMA prev | EMA prev2 | | 5 day EMA | 92.02 | 92.38 | 92.52 | | 12 day EMA | 92.81 | 93.09 | 93.27 | | 20 day EMA | 92.79 | 92.95 | 93.04 | | 35 day EMA | 91.44 | 91.45 | 91.41 | | 50 day EMA | 89.77 | 89.71 | 89.61 |
SMA (simple moving average) of Goldman Sachs PSUBNKBEES
| SMA period | SMA current | SMA prev | SMA prev2 | | 5 day SMA | 91.94 | 92.09 | 92.68 | | 12 day SMA | 93.5 | 93.65 | 93.75 | | 20 day SMA | 93.72 | 93.82 | 93.84 | | 35 day SMA | 92.54 | 92.43 | 92.23 | | 50 day SMA | 90.25 | 90.05 | 89.86 | | 100 day SMA | 84.34 | 84.24 | 84.12 | | 150 day SMA | 81.93 | 81.78 | 81.63 | | 200 day SMA | 78.58 | 78.45 | 78.32 |
|
|
