PS PSRAJ_ST full analysis,charts,indicators,moving averages,SMA,DMA,EMA,ADX,MACD,RSIP S PSRAJ_ST WideScreen charts, DMA,SMA,EMA technical analysis, forecast prediction, by indicators ADX,MACD,RSI,CCI NSE stock exchange
Daily price and charts and targets PS Strong Daily Stock price targets for PS PSRAJ_ST are 269.5 and 272.5 | Daily Target 1 | 269 | | Daily Target 2 | 270 | | Daily Target 3 | 272 | | Daily Target 4 | 273 | | Daily Target 5 | 275 |
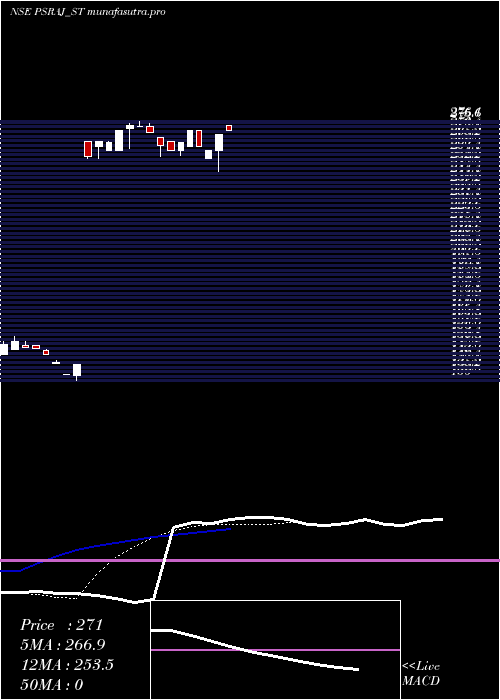
Daily price and volume P S
| Date |
Closing |
Open |
Range |
Volume |
Tue 28 October 2025 |
271.00 (0.74%) |
274.00 |
271.00 - 274.00 |
0.1961 times |
Mon 27 October 2025 |
269.00 (3.46%) |
260.00 |
248.00 - 269.00 |
2.9412 times |
Fri 24 October 2025 |
260.00 (-0.69%) |
255.00 |
255.00 - 260.00 |
0.2941 times |
Thu 23 October 2025 |
261.80 (-3.39%) |
271.00 |
261.80 - 271.00 |
0.1961 times |
Tue 21 October 2025 |
271.00 (2.65%) |
262.00 |
262.00 - 271.00 |
0.1961 times |
Mon 20 October 2025 |
264.00 (1.54%) |
260.00 |
257.00 - 264.00 |
0.2941 times |
Fri 17 October 2025 |
260.00 (-1.03%) |
265.00 |
260.00 - 265.00 |
1.6667 times |
Thu 16 October 2025 |
262.70 (-2.7%) |
267.00 |
256.50 - 267.00 |
1.4706 times |
Wed 15 October 2025 |
270.00 (-1.1%) |
273.00 |
270.00 - 275.00 |
2.3529 times |
Tue 14 October 2025 |
273.00 (-0.31%) |
273.00 |
273.00 - 276.10 |
0.3922 times |
Mon 13 October 2025 |
273.85 (1.05%) |
272.00 |
261.00 - 275.00 |
1.9608 times |
Weekly price and charts PS Strong weekly Stock price targets for PS PSRAJ_ST are 259.5 and 285.5 | Weekly Target 1 | 238.33 | | Weekly Target 2 | 254.67 | | Weekly Target 3 | 264.33333333333 | | Weekly Target 4 | 280.67 | | Weekly Target 5 | 290.33 |
Weekly price and volumes for P S
| Date |
Closing |
Open |
Range |
Volume |
Tue 28 October 2025 |
271.00 (4.23%) |
260.00 |
248.00 - 274.00 |
0.6982 times |
Fri 24 October 2025 |
260.00 (0%) |
260.00 |
255.00 - 271.00 |
0.2182 times |
Fri 17 October 2025 |
260.00 (-4.06%) |
272.00 |
256.50 - 276.10 |
1.7455 times |
Fri 10 October 2025 |
271.00 (94.96%) |
265.00 |
255.00 - 271.00 |
1.6145 times |
Tue 04 March 2025 |
139.00 (-1.1%) |
133.55 |
130.00 - 139.00 |
0.5236 times |
Thu 27 February 2025 |
140.55 (0%) |
150.00 |
140.00 - 150.05 |
1.2 times |
Wed 29 October 2025 |
(0%) |
|
- |
0 times |

Monthly price and charts PS Strong monthly Stock price targets for PS PSRAJ_ST are 259.5 and 287.6 | Monthly Target 1 | 236.93 | | Monthly Target 2 | 253.97 | | Monthly Target 3 | 265.03333333333 | | Monthly Target 4 | 282.07 | | Monthly Target 5 | 293.13 |
Monthly price and volumes P S
| Date |
Closing |
Open |
Range |
Volume |
Tue 28 October 2025 |
271.00 (94.96%) |
265.00 |
248.00 - 276.10 |
0.5573 times |
Tue 04 March 2025 |
139.00 (-1.1%) |
133.55 |
130.00 - 139.00 |
0.0682 times |
Thu 27 February 2025 |
140.55 (0%) |
145.00 |
140.00 - 155.00 |
2.3744 times |
Wed 29 October 2025 |
(0%) |
|
- |
0 times |

DMA SMA EMA moving averages of P S PSRAJ_ST
DMA (daily moving average) of P S PSRAJ_ST
| DMA period | DMA value | | 5 day DMA | 266.56 | | 12 day DMA | 267.28 | | 20 day DMA | 234.95 | | 35 day DMA | | | 50 day DMA | | | 100 day DMA | | | 150 day DMA | | | 200 day DMA | | EMA (exponential moving average) of P S PSRAJ_ST
| EMA period | EMA current | EMA prev | EMA prev2 | | 5 day EMA | 266.91 | 264.86 | 262.79 | | 12 day EMA | 253.52 | 250.34 | 246.95 | | 20 day EMA | 230.37 | 226.09 | 221.57 | | 35 day EMA | 0 | 0 | 0 | | 50 day EMA | 0 | 0 | 0 |
SMA (simple moving average) of P S PSRAJ_ST
| SMA period | SMA current | SMA prev | SMA prev2 | | 5 day SMA | 266.56 | 265.16 | 263.36 | | 12 day SMA | 267.28 | 266.7 | 266.36 | | 20 day SMA | 234.95 | 228.85 | | 35 day SMA | | 50 day SMA | | 100 day SMA | | 150 day SMA | | 200 day SMA |
|
|
