ProzoneRealty PROZONER_BE full analysis,charts,indicators,moving averages,SMA,DMA,EMA,ADX,MACD,RSIProzone Realty PROZONER_BE WideScreen charts, DMA,SMA,EMA technical analysis, forecast prediction, by indicators ADX,MACD,RSI,CCI NSE stock exchange
Daily price and charts and targets ProzoneRealty Strong Daily Stock price targets for ProzoneRealty PROZONER_BE are 71.39 and 74.15 | Daily Target 1 | 69.09 | | Daily Target 2 | 70.93 | | Daily Target 3 | 71.85 | | Daily Target 4 | 73.69 | | Daily Target 5 | 74.61 |
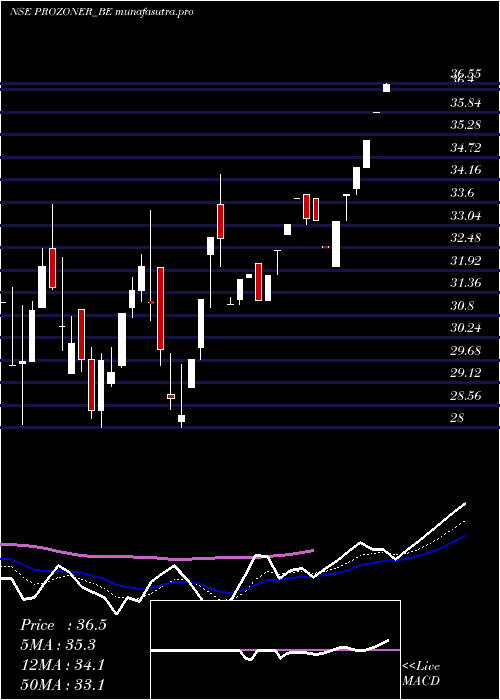
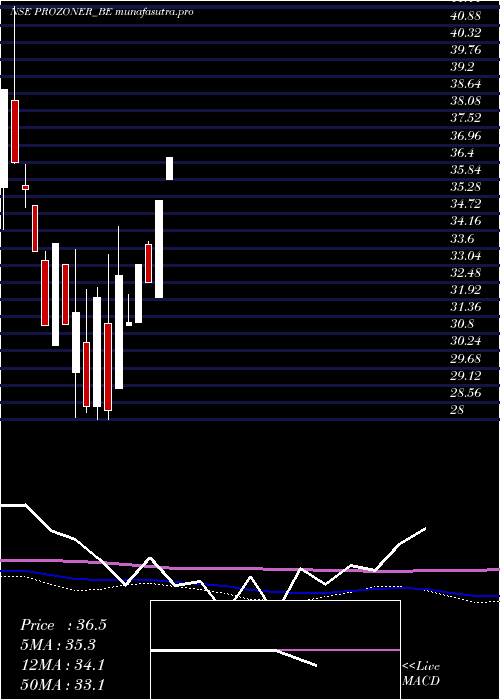
Daily price and volume Prozone Realty
| Date |
Closing |
Open |
Range |
Volume |
Wed 29 October 2025 |
72.77 (4.99%) |
72.77 |
70.01 - 72.77 |
2.6381 times |
Tue 28 October 2025 |
69.31 (5%) |
69.24 |
67.50 - 69.31 |
0.7691 times |
Mon 27 October 2025 |
66.01 (4.99%) |
66.01 |
64.40 - 66.01 |
2.8566 times |
Fri 24 October 2025 |
62.87 (4.99%) |
60.20 |
59.50 - 62.87 |
1.1924 times |
Thu 23 October 2025 |
59.88 (0.67%) |
59.50 |
58.20 - 61.45 |
1.0233 times |
Tue 21 October 2025 |
59.48 (0.42%) |
59.99 |
59.00 - 61.50 |
0.278 times |
Mon 20 October 2025 |
59.23 (1.53%) |
58.00 |
58.00 - 60.00 |
0.3498 times |
Fri 17 October 2025 |
58.34 (-0.7%) |
57.65 |
57.65 - 59.00 |
0.2407 times |
Thu 16 October 2025 |
58.75 (0.34%) |
58.55 |
58.50 - 59.70 |
0.2056 times |
Wed 15 October 2025 |
58.55 (-0.83%) |
58.00 |
58.00 - 59.55 |
0.4464 times |
Tue 14 October 2025 |
59.04 (-1.98%) |
59.75 |
59.00 - 60.70 |
0.4241 times |
Weekly price and charts ProzoneRealty Strong weekly Stock price targets for ProzoneRealty PROZONER_BE are 68.59 and 76.96 | Weekly Target 1 | 61.61 | | Weekly Target 2 | 67.19 | | Weekly Target 3 | 69.98 | | Weekly Target 4 | 75.56 | | Weekly Target 5 | 78.35 |
Weekly price and volumes for Prozone Realty
| Date |
Closing |
Open |
Range |
Volume |
Wed 29 October 2025 |
72.77 (15.75%) |
66.01 |
64.40 - 72.77 |
2.8241 times |
Fri 24 October 2025 |
62.87 (7.76%) |
58.00 |
58.00 - 62.87 |
1.282 times |
Fri 17 October 2025 |
58.34 (-2.9%) |
60.08 |
57.65 - 60.70 |
0.8675 times |
Fri 10 October 2025 |
60.08 (73.44%) |
56.25 |
56.20 - 60.50 |
2.0728 times |
Fri 06 June 2025 |
34.64 (-1.09%) |
33.70 |
33.63 - 34.99 |
0.2566 times |
Fri 30 May 2025 |
35.02 (0.06%) |
34.90 |
34.33 - 36.00 |
0.3321 times |
Fri 23 May 2025 |
35.00 (-3.69%) |
36.34 |
34.50 - 36.34 |
0.2394 times |
Fri 16 May 2025 |
36.34 (2.98%) |
35.00 |
35.00 - 36.34 |
0.4923 times |
Fri 09 May 2025 |
35.29 (0.43%) |
35.84 |
35.28 - 36.70 |
0.5743 times |
Fri 02 May 2025 |
35.14 (8.16%) |
32.00 |
32.00 - 35.14 |
1.059 times |
Fri 25 April 2025 |
32.49 (-1.69%) |
33.71 |
32.49 - 33.80 |
0.3502 times |
Monthly price and charts ProzoneRealty Strong monthly Stock price targets for ProzoneRealty PROZONER_BE are 64.49 and 81.06 | Monthly Target 1 | 50.68 | | Monthly Target 2 | 61.72 | | Monthly Target 3 | 67.246666666667 | | Monthly Target 4 | 78.29 | | Monthly Target 5 | 83.82 |
Monthly price and volumes Prozone Realty
| Date |
Closing |
Open |
Range |
Volume |
Wed 29 October 2025 |
72.77 (110.08%) |
56.25 |
56.20 - 72.77 |
2.2421 times |
Fri 06 June 2025 |
34.64 (-1.09%) |
33.70 |
33.63 - 34.99 |
0.0816 times |
Fri 30 May 2025 |
35.02 (1.63%) |
34.46 |
34.33 - 36.70 |
0.6148 times |
Wed 30 April 2025 |
34.46 (21.77%) |
29.00 |
29.00 - 34.46 |
0.7431 times |
Fri 28 March 2025 |
28.30 (-9.03%) |
29.55 |
28.00 - 33.56 |
1.0123 times |
Fri 28 February 2025 |
31.11 (-12.39%) |
35.00 |
30.43 - 35.00 |
0.4536 times |
Fri 31 January 2025 |
35.51 (0%) |
36.00 |
34.20 - 41.50 |
1.8525 times |
Wed 29 October 2025 |
(0%) |
|
- |
0 times |

DMA SMA EMA moving averages of Prozone Realty PROZONER_BE
DMA (daily moving average) of Prozone Realty PROZONER_BE
| DMA period | DMA value | | 5 day DMA | 66.17 | | 12 day DMA | 62.04 | | 20 day DMA | 55.82 | | 35 day DMA | 46.99 | | 50 day DMA | 43.24 | | 100 day DMA | 37.52 | | 150 day DMA | | | 200 day DMA | | EMA (exponential moving average) of Prozone Realty PROZONER_BE
| EMA period | EMA current | EMA prev | EMA prev2 | | 5 day EMA | 67.34 | 64.62 | 62.27 | | 12 day EMA | 61.98 | 60.02 | 58.33 | | 20 day EMA | 57.15 | 55.51 | 54.06 | | 35 day EMA | 51 | 49.72 | 48.57 | | 50 day EMA | 44.62 | 43.47 | 42.42 |
SMA (simple moving average) of Prozone Realty PROZONER_BE
| SMA period | SMA current | SMA prev | SMA prev2 | | 5 day SMA | 66.17 | 63.51 | 61.49 | | 12 day SMA | 62.04 | 60.98 | 60.06 | | 20 day SMA | 55.82 | 53.89 | 52.18 | | 35 day SMA | 46.99 | 45.92 | 44.95 | | 50 day SMA | 43.24 | 42.43 | 41.68 | | 100 day SMA | 37.52 | 37.15 | 36.81 | | 150 day SMA | | 200 day SMA |
|
|
