PrajayEngineers PRAENG full analysis,charts,indicators,moving averages,SMA,DMA,EMA,ADX,MACD,RSIPrajay Engineers PRAENG WideScreen charts, DMA,SMA,EMA technical analysis, forecast prediction, by indicators ADX,MACD,RSI,CCI NSE stock exchange
operates under Realty sector
Daily price and charts and targets PrajayEngineers Strong Daily Stock price targets for PrajayEngineers PRAENG are 22.3 and 23.6 | Daily Target 1 | 21.39 | | Daily Target 2 | 21.9 | | Daily Target 3 | 22.693333333333 | | Daily Target 4 | 23.2 | | Daily Target 5 | 23.99 |
Daily price and volume Prajay Engineers
| Date |
Closing |
Open |
Range |
Volume |
Fri 11 July 2025 |
22.40 (-0.09%) |
22.30 |
22.19 - 23.49 |
2.7089 times |
Thu 10 July 2025 |
22.42 (-0.04%) |
22.25 |
22.08 - 22.85 |
1.3932 times |
Wed 09 July 2025 |
22.43 (-0.04%) |
22.74 |
22.21 - 22.74 |
0.7797 times |
Tue 08 July 2025 |
22.44 (0.49%) |
22.75 |
22.16 - 22.75 |
0.3237 times |
Mon 07 July 2025 |
22.33 (-0.89%) |
22.98 |
21.69 - 23.00 |
0.7475 times |
Fri 04 July 2025 |
22.53 (-0.92%) |
22.50 |
22.22 - 23.09 |
0.6631 times |
Thu 03 July 2025 |
22.74 (-3.11%) |
23.10 |
22.54 - 23.49 |
0.7085 times |
Wed 02 July 2025 |
23.47 (0.9%) |
23.95 |
22.92 - 23.95 |
0.9146 times |
Tue 01 July 2025 |
23.26 (2.11%) |
22.78 |
22.54 - 24.20 |
1.2268 times |
Mon 30 June 2025 |
22.78 (1.83%) |
22.50 |
22.32 - 22.86 |
0.534 times |
Fri 27 June 2025 |
22.37 (-3.08%) |
22.81 |
22.05 - 23.28 |
0.9371 times |
Weekly price and charts PrajayEngineers Strong weekly Stock price targets for PrajayEngineers PRAENG are 21.15 and 22.95 | Weekly Target 1 | 20.73 | | Weekly Target 2 | 21.56 | | Weekly Target 3 | 22.526666666667 | | Weekly Target 4 | 23.36 | | Weekly Target 5 | 24.33 |
Weekly price and volumes for Prajay Engineers
| Date |
Closing |
Open |
Range |
Volume |
Fri 11 July 2025 |
22.40 (-0.58%) |
22.98 |
21.69 - 23.49 |
0.8206 times |
Fri 04 July 2025 |
22.53 (0.72%) |
22.50 |
22.22 - 24.20 |
0.5578 times |
Fri 27 June 2025 |
22.37 (-0.04%) |
22.75 |
22.03 - 23.99 |
1.0146 times |
Fri 20 June 2025 |
22.38 (-2.01%) |
22.83 |
21.75 - 25.24 |
1.5641 times |
Fri 13 June 2025 |
22.84 (11.09%) |
20.51 |
20.30 - 25.44 |
3.0403 times |
Fri 06 June 2025 |
20.56 (2.8%) |
20.00 |
19.65 - 21.50 |
0.5291 times |
Fri 30 May 2025 |
20.00 (-2.72%) |
21.20 |
19.70 - 21.78 |
0.3593 times |
Fri 23 May 2025 |
20.56 (-0.1%) |
20.50 |
19.11 - 21.38 |
0.4011 times |
Fri 16 May 2025 |
20.58 (19.3%) |
17.70 |
17.70 - 21.40 |
1.07 times |
Fri 09 May 2025 |
17.25 (-13.36%) |
20.55 |
17.12 - 20.94 |
0.6431 times |
Fri 02 May 2025 |
19.91 (-5.37%) |
22.00 |
19.00 - 22.00 |
0.3236 times |

Monthly price and charts PrajayEngineers Strong monthly Stock price targets for PrajayEngineers PRAENG are 20.79 and 23.3 | Monthly Target 1 | 20.25 | | Monthly Target 2 | 21.33 | | Monthly Target 3 | 22.763333333333 | | Monthly Target 4 | 23.84 | | Monthly Target 5 | 25.27 |
Monthly price and volumes Prajay Engineers
| Date |
Closing |
Open |
Range |
Volume |
Fri 11 July 2025 |
22.40 (-1.67%) |
22.78 |
21.69 - 24.20 |
0.2641 times |
Mon 30 June 2025 |
22.78 (13.9%) |
20.00 |
19.65 - 25.44 |
1.2594 times |
Fri 30 May 2025 |
20.00 (3.25%) |
19.55 |
17.12 - 21.78 |
0.5174 times |
Wed 30 April 2025 |
19.37 (-6.79%) |
20.50 |
18.42 - 24.40 |
0.53 times |
Fri 28 March 2025 |
20.78 (-6.23%) |
22.00 |
19.61 - 24.52 |
1.2784 times |
Fri 28 February 2025 |
22.16 (-15.16%) |
27.41 |
17.75 - 27.41 |
1.7136 times |
Fri 31 January 2025 |
26.12 (-11.49%) |
29.70 |
22.76 - 34.89 |
0.6931 times |
Tue 31 December 2024 |
29.51 (-29.87%) |
30.98 |
26.52 - 33.33 |
0.4264 times |
Thu 29 August 2024 |
42.08 (5.78%) |
40.48 |
31.61 - 46.20 |
1.6081 times |
Wed 31 July 2024 |
39.78 (30.21%) |
30.55 |
29.10 - 43.91 |
1.7095 times |
Fri 28 June 2024 |
30.55 (45.82%) |
29.70 |
29.69 - 37.70 |
0.8529 times |

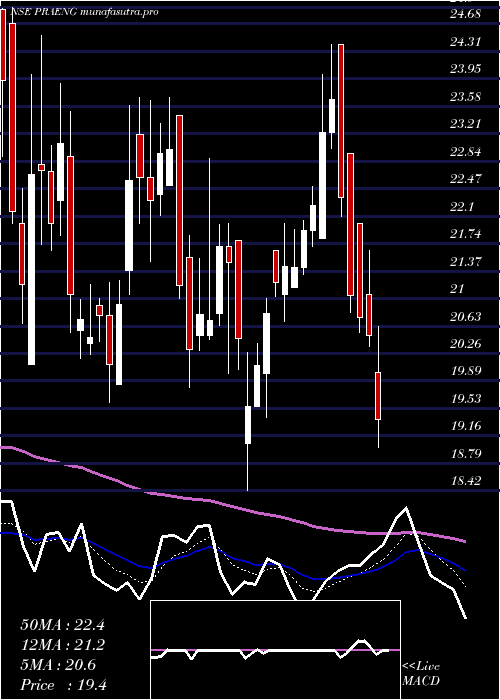
DMA SMA EMA moving averages of Prajay Engineers PRAENG
DMA (daily moving average) of Prajay Engineers PRAENG
| DMA period | DMA value | | 5 day DMA | 22.4 | | 12 day DMA | 22.69 | | 20 day DMA | 22.75 | | 35 day DMA | 21.98 | | 50 day DMA | 21.21 | | 100 day DMA | 21.33 | | 150 day DMA | 23.77 | | 200 day DMA | 26.81 | EMA (exponential moving average) of Prajay Engineers PRAENG
| EMA period | EMA current | EMA prev | EMA prev2 | | 5 day EMA | 22.47 | 22.5 | 22.54 | | 12 day EMA | 22.54 | 22.57 | 22.6 | | 20 day EMA | 22.41 | 22.41 | 22.41 | | 35 day EMA | 21.91 | 21.88 | 21.85 | | 50 day EMA | 21.26 | 21.21 | 21.16 |
SMA (simple moving average) of Prajay Engineers PRAENG
| SMA period | SMA current | SMA prev | SMA prev2 | | 5 day SMA | 22.4 | 22.43 | 22.49 | | 12 day SMA | 22.69 | 22.72 | 22.74 | | 20 day SMA | 22.75 | 22.78 | 22.82 | | 35 day SMA | 21.98 | 21.93 | 21.86 | | 50 day SMA | 21.21 | 21.16 | 21.1 | | 100 day SMA | 21.33 | 21.32 | 21.33 | | 150 day SMA | 23.77 | 23.83 | 23.89 | | 200 day SMA | 26.81 | 26.87 | 26.94 |
|
|
