PolyplexCorporation POLYPLEX full analysis,charts,indicators,moving averages,SMA,DMA,EMA,ADX,MACD,RSIPolyplex Corporation POLYPLEX WideScreen charts, DMA,SMA,EMA technical analysis, forecast prediction, by indicators ADX,MACD,RSI,CCI NSE stock exchange
operates under Commodity Chemicals sector
Daily price and charts and targets PolyplexCorporation Strong Daily Stock price targets for PolyplexCorporation POLYPLEX are 963.25 and 982.95 | Daily Target 1 | 958.97 | | Daily Target 2 | 967.53 | | Daily Target 3 | 978.66666666667 | | Daily Target 4 | 987.23 | | Daily Target 5 | 998.37 |
Daily price and volume Polyplex Corporation
| Date |
Closing |
Open |
Range |
Volume |
Tue 28 October 2025 |
976.10 (-1.15%) |
987.00 |
970.10 - 989.80 |
0.7296 times |
Mon 27 October 2025 |
987.50 (1.49%) |
975.00 |
967.70 - 992.00 |
1.6252 times |
Fri 24 October 2025 |
973.00 (-0.88%) |
995.00 |
970.20 - 995.00 |
0.6645 times |
Thu 23 October 2025 |
981.60 (-0.26%) |
984.30 |
969.70 - 992.20 |
1.1976 times |
Tue 21 October 2025 |
984.20 (1.48%) |
980.00 |
975.10 - 987.20 |
0.38 times |
Mon 20 October 2025 |
969.80 (0.12%) |
965.00 |
959.00 - 980.30 |
1.0672 times |
Fri 17 October 2025 |
968.60 (-0.87%) |
975.40 |
965.30 - 981.00 |
0.5764 times |
Thu 16 October 2025 |
977.10 (1.14%) |
968.00 |
968.00 - 995.90 |
0.9331 times |
Wed 15 October 2025 |
966.10 (-0.65%) |
972.70 |
963.60 - 977.80 |
1.2289 times |
Tue 14 October 2025 |
972.40 (-2.57%) |
997.20 |
971.00 - 1000.40 |
1.5975 times |
Mon 13 October 2025 |
998.10 (0.04%) |
998.40 |
995.00 - 1004.10 |
0.8427 times |
Weekly price and charts PolyplexCorporation Strong weekly Stock price targets for PolyplexCorporation POLYPLEX are 971.9 and 996.2 | Weekly Target 1 | 954.3 | | Weekly Target 2 | 965.2 | | Weekly Target 3 | 978.6 | | Weekly Target 4 | 989.5 | | Weekly Target 5 | 1002.9 |
Weekly price and volumes for Polyplex Corporation
| Date |
Closing |
Open |
Range |
Volume |
Tue 28 October 2025 |
976.10 (0.32%) |
975.00 |
967.70 - 992.00 |
0.3839 times |
Fri 24 October 2025 |
973.00 (0.45%) |
965.00 |
959.00 - 995.00 |
0.5395 times |
Fri 17 October 2025 |
968.60 (-2.92%) |
998.40 |
963.60 - 1004.10 |
0.8443 times |
Fri 10 October 2025 |
997.70 (-4.56%) |
1049.00 |
991.10 - 1054.10 |
1.2595 times |
Fri 03 October 2025 |
1045.40 (-0.57%) |
1048.70 |
1021.00 - 1062.00 |
0.7136 times |
Fri 26 September 2025 |
1051.40 (-1.34%) |
1067.80 |
1048.70 - 1095.00 |
1.5582 times |
Fri 19 September 2025 |
1065.70 (5.11%) |
1014.90 |
1011.10 - 1075.50 |
1.5993 times |
Fri 12 September 2025 |
1013.90 (-1.63%) |
1024.40 |
998.00 - 1045.70 |
1.1913 times |
Fri 05 September 2025 |
1030.70 (1.85%) |
1010.30 |
1005.20 - 1038.70 |
0.946 times |
Fri 29 August 2025 |
1012.00 (-0.47%) |
1023.80 |
991.40 - 1025.10 |
0.9644 times |
Fri 22 August 2025 |
1016.80 (-5.27%) |
1075.00 |
1004.70 - 1080.00 |
2.0484 times |
Monthly price and charts PolyplexCorporation Strong monthly Stock price targets for PolyplexCorporation POLYPLEX are 916.05 and 1019.05 | Monthly Target 1 | 896.03 | | Monthly Target 2 | 936.07 | | Monthly Target 3 | 999.03333333333 | | Monthly Target 4 | 1039.07 | | Monthly Target 5 | 1102.03 |
Monthly price and volumes Polyplex Corporation
| Date |
Closing |
Open |
Range |
Volume |
Tue 28 October 2025 |
976.10 (-5.95%) |
1048.30 |
959.00 - 1062.00 |
0.3909 times |
Tue 30 September 2025 |
1037.90 (2.56%) |
1010.30 |
998.00 - 1095.00 |
0.6715 times |
Fri 29 August 2025 |
1012.00 (-9.8%) |
1117.40 |
991.40 - 1179.90 |
0.8067 times |
Thu 31 July 2025 |
1121.90 (-7.38%) |
1211.30 |
1089.00 - 1224.60 |
0.8074 times |
Mon 30 June 2025 |
1211.30 (-9.08%) |
1340.00 |
1190.00 - 1380.00 |
1.2563 times |
Fri 30 May 2025 |
1332.30 (9.29%) |
1219.00 |
1148.50 - 1398.00 |
1.8698 times |
Wed 30 April 2025 |
1219.00 (2.03%) |
1180.00 |
1129.00 - 1302.30 |
0.7823 times |
Fri 28 March 2025 |
1194.75 (10.15%) |
1083.55 |
1050.00 - 1264.00 |
0.7587 times |
Fri 28 February 2025 |
1084.65 (-4.44%) |
1105.00 |
1071.30 - 1213.85 |
0.9757 times |
Fri 31 January 2025 |
1135.00 (-12.25%) |
1293.60 |
1020.10 - 1410.95 |
1.6806 times |
Tue 31 December 2024 |
1293.40 (0.83%) |
1283.00 |
1255.50 - 1478.70 |
3.0527 times |
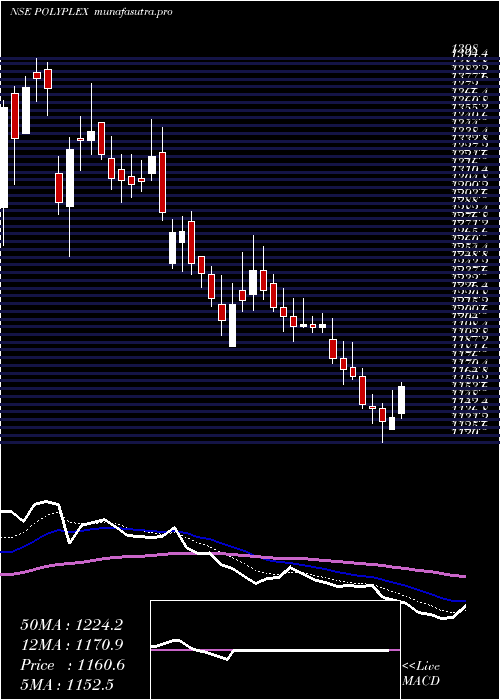
DMA SMA EMA moving averages of Polyplex Corporation POLYPLEX
DMA (daily moving average) of Polyplex Corporation POLYPLEX
| DMA period | DMA value | | 5 day DMA | 980.48 | | 12 day DMA | 979.35 | | 20 day DMA | 997.79 | | 35 day DMA | 1019.93 | | 50 day DMA | 1023.25 | | 100 day DMA | 1103.94 | | 150 day DMA | 1153.06 | | 200 day DMA | 1159.32 | EMA (exponential moving average) of Polyplex Corporation POLYPLEX
| EMA period | EMA current | EMA prev | EMA prev2 | | 5 day EMA | 979.11 | 980.61 | 977.17 | | 12 day EMA | 985.43 | 987.13 | 987.06 | | 20 day EMA | 996.34 | 998.47 | 999.62 | | 35 day EMA | 1010.53 | 1012.56 | 1014.04 | | 50 day EMA | 1027.41 | 1029.5 | 1031.21 |
SMA (simple moving average) of Polyplex Corporation POLYPLEX
| SMA period | SMA current | SMA prev | SMA prev2 | | 5 day SMA | 980.48 | 979.22 | 975.44 | | 12 day SMA | 979.35 | 981.18 | 982.53 | | 20 day SMA | 997.79 | 1001.55 | 1005.84 | | 35 day SMA | 1019.93 | 1021.49 | 1022.21 | | 50 day SMA | 1023.25 | 1025.52 | 1028.43 | | 100 day SMA | 1103.94 | 1107.47 | 1111.04 | | 150 day SMA | 1153.06 | 1154.53 | 1155.73 | | 200 day SMA | 1159.32 | 1161 | 1162.96 |
|
|
