PolyMedicure POLYMED full analysis,charts,indicators,moving averages,SMA,DMA,EMA,ADX,MACD,RSIPoly Medicure POLYMED WideScreen charts, DMA,SMA,EMA technical analysis, forecast prediction, by indicators ADX,MACD,RSI,CCI NSE stock exchange
operates under Medical Equipment sector
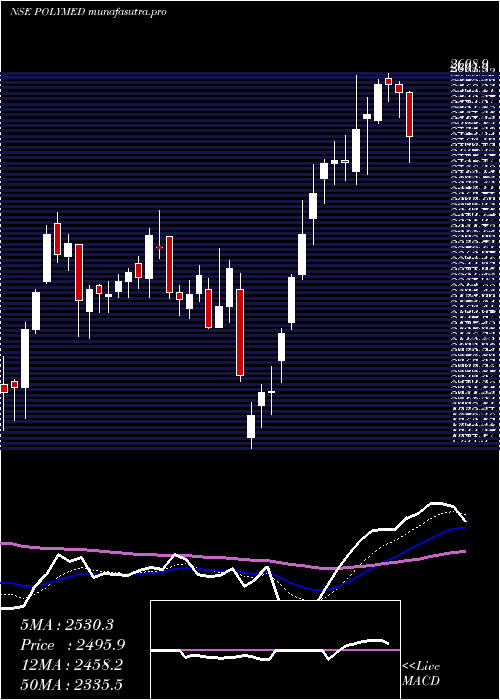
Daily price and charts and targets PolyMedicure Strong Daily Stock price targets for PolyMedicure POLYMED are 1928.7 and 2019.1 | Daily Target 1 | 1855.17 | | Daily Target 2 | 1911.83 | | Daily Target 3 | 1945.5666666667 | | Daily Target 4 | 2002.23 | | Daily Target 5 | 2035.97 |
Daily price and volume Poly Medicure
| Date |
Closing |
Open |
Range |
Volume |
Wed 29 October 2025 |
1968.50 (3.3%) |
1914.00 |
1888.90 - 1979.30 |
0.898 times |
Tue 28 October 2025 |
1905.60 (0.19%) |
1904.90 |
1900.00 - 1928.00 |
0.4431 times |
Mon 27 October 2025 |
1902.00 (-1.04%) |
1922.00 |
1884.10 - 1926.70 |
0.6034 times |
Fri 24 October 2025 |
1922.00 (-0.06%) |
1929.90 |
1896.00 - 1929.90 |
0.5627 times |
Thu 23 October 2025 |
1923.10 (-0.6%) |
1942.80 |
1892.00 - 1942.90 |
1.0498 times |
Tue 21 October 2025 |
1934.70 (2.94%) |
1896.00 |
1896.00 - 1969.00 |
0.7814 times |
Mon 20 October 2025 |
1879.40 (-1.35%) |
1910.00 |
1865.30 - 1914.50 |
0.7082 times |
Fri 17 October 2025 |
1905.20 (-0.8%) |
1924.90 |
1888.00 - 1927.40 |
0.4595 times |
Thu 16 October 2025 |
1920.50 (4.47%) |
1854.80 |
1840.00 - 1960.00 |
4.107 times |
Wed 15 October 2025 |
1838.30 (-1.02%) |
1865.00 |
1834.30 - 1869.90 |
0.387 times |
Tue 14 October 2025 |
1857.20 (-0.4%) |
1869.90 |
1850.10 - 1888.00 |
0.4835 times |
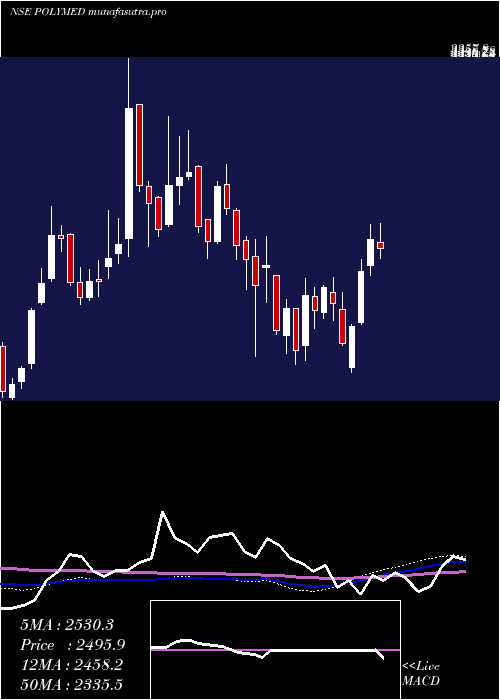
Weekly price and charts PolyMedicure Strong weekly Stock price targets for PolyMedicure POLYMED are 1926.3 and 2021.5 | Weekly Target 1 | 1848.77 | | Weekly Target 2 | 1908.63 | | Weekly Target 3 | 1943.9666666667 | | Weekly Target 4 | 2003.83 | | Weekly Target 5 | 2039.17 |
Weekly price and volumes for Poly Medicure
| Date |
Closing |
Open |
Range |
Volume |
Wed 29 October 2025 |
1968.50 (2.42%) |
1922.00 |
1884.10 - 1979.30 |
0.3918 times |
Fri 24 October 2025 |
1922.00 (0.88%) |
1910.00 |
1865.30 - 1969.00 |
0.625 times |
Fri 17 October 2025 |
1905.20 (0.49%) |
1890.40 |
1834.30 - 1960.00 |
1.19 times |
Fri 10 October 2025 |
1896.00 (-0.77%) |
1913.00 |
1848.80 - 1925.90 |
0.8906 times |
Fri 03 October 2025 |
1910.80 (-2.49%) |
1974.90 |
1875.20 - 1978.50 |
0.9749 times |
Fri 26 September 2025 |
1959.50 (-1.84%) |
2000.00 |
1921.20 - 2080.00 |
1.3387 times |
Fri 19 September 2025 |
1996.20 (-1.29%) |
2030.90 |
1978.00 - 2107.80 |
1.4729 times |
Fri 12 September 2025 |
2022.20 (-0.96%) |
2041.80 |
1937.60 - 2070.00 |
1.5764 times |
Fri 05 September 2025 |
2041.80 (-2.09%) |
2080.00 |
2020.00 - 2144.90 |
0.7173 times |
Fri 29 August 2025 |
2085.40 (0.71%) |
2078.90 |
2050.00 - 2138.90 |
0.8226 times |
Fri 22 August 2025 |
2070.60 (8.84%) |
1919.90 |
1870.20 - 2096.90 |
1.8383 times |
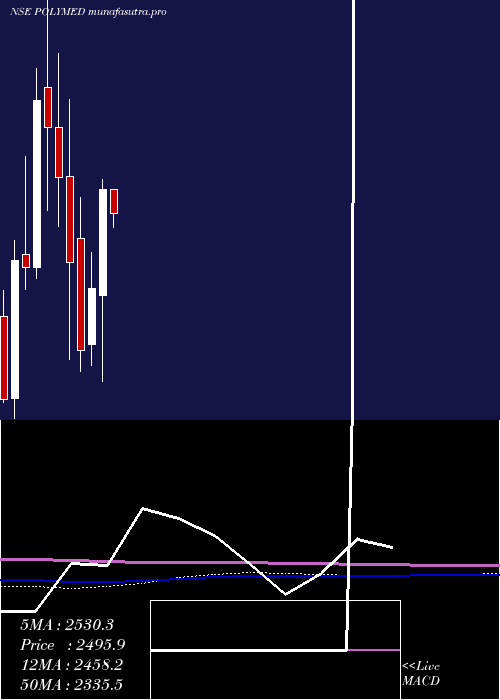
Monthly price and charts PolyMedicure Strong monthly Stock price targets for PolyMedicure POLYMED are 1901.4 and 2046.4 | Monthly Target 1 | 1782.37 | | Monthly Target 2 | 1875.43 | | Monthly Target 3 | 1927.3666666667 | | Monthly Target 4 | 2020.43 | | Monthly Target 5 | 2072.37 |
Monthly price and volumes Poly Medicure
| Date |
Closing |
Open |
Range |
Volume |
Wed 29 October 2025 |
1968.50 (1.05%) |
1945.20 |
1834.30 - 1979.30 |
0.8301 times |
Tue 30 September 2025 |
1948.10 (-6.58%) |
2080.00 |
1921.20 - 2144.90 |
1.1191 times |
Fri 29 August 2025 |
2085.40 (7.62%) |
1947.90 |
1821.20 - 2138.90 |
1.233 times |
Thu 31 July 2025 |
1937.80 (-12.85%) |
2227.90 |
1932.10 - 2316.60 |
0.7299 times |
Mon 30 June 2025 |
2223.60 (-1.55%) |
2245.00 |
2031.80 - 2313.00 |
0.9661 times |
Fri 30 May 2025 |
2258.60 (-12.25%) |
2574.00 |
2240.00 - 2937.60 |
1.734 times |
Wed 30 April 2025 |
2574.00 (14.64%) |
2220.00 |
1934.50 - 2608.90 |
0.6886 times |
Fri 28 March 2025 |
2245.25 (10.3%) |
2055.90 |
1986.25 - 2363.45 |
0.4775 times |
Fri 28 February 2025 |
2035.50 (-12.64%) |
2410.75 |
1967.85 - 2550.00 |
1.232 times |
Fri 31 January 2025 |
2330.00 (-10.91%) |
2620.00 |
2008.15 - 2876.45 |
0.9896 times |
Tue 31 December 2024 |
2615.25 (-6.01%) |
2782.55 |
2450.35 - 3031.00 |
0.9618 times |
DMA SMA EMA moving averages of Poly Medicure POLYMED
DMA (daily moving average) of Poly Medicure POLYMED
| DMA period | DMA value | | 5 day DMA | 1924.24 | | 12 day DMA | 1901.77 | | 20 day DMA | 1904.59 | | 35 day DMA | 1940.31 | | 50 day DMA | 1968.17 | | 100 day DMA | 2040.01 | | 150 day DMA | 2148.89 | | 200 day DMA | 2191.85 | EMA (exponential moving average) of Poly Medicure POLYMED
| EMA period | EMA current | EMA prev | EMA prev2 | | 5 day EMA | 1928.44 | 1908.42 | 1909.83 | | 12 day EMA | 1916.64 | 1907.22 | 1907.52 | | 20 day EMA | 1919.97 | 1914.86 | 1915.83 | | 35 day EMA | 1935.45 | 1933.5 | 1935.14 | | 50 day EMA | 1959.54 | 1959.17 | 1961.36 |
SMA (simple moving average) of Poly Medicure POLYMED
| SMA period | SMA current | SMA prev | SMA prev2 | | 5 day SMA | 1924.24 | 1917.48 | 1912.24 | | 12 day SMA | 1901.77 | 1895.73 | 1895.39 | | 20 day SMA | 1904.59 | 1902.87 | 1905.56 | | 35 day SMA | 1940.31 | 1941.73 | 1945.62 | | 50 day SMA | 1968.17 | 1966.85 | 1965.66 | | 100 day SMA | 2040.01 | 2042.7 | 2046.01 | | 150 day SMA | 2148.89 | 2150.72 | 2153.01 | | 200 day SMA | 2191.85 | 2196.22 | 2200.82 |
|
|
