PritishNandy PNC_BE full analysis,charts,indicators,moving averages,SMA,DMA,EMA,ADX,MACD,RSIPritish Nandy PNC_BE WideScreen charts, DMA,SMA,EMA technical analysis, forecast prediction, by indicators ADX,MACD,RSI,CCI NSE stock exchange
Daily price and charts and targets PritishNandy Strong Daily Stock price targets for PritishNandy PNC_BE are 27.37 and 29.12 | Daily Target 1 | 27.06 | | Daily Target 2 | 27.68 | | Daily Target 3 | 28.813333333333 | | Daily Target 4 | 29.43 | | Daily Target 5 | 30.56 |
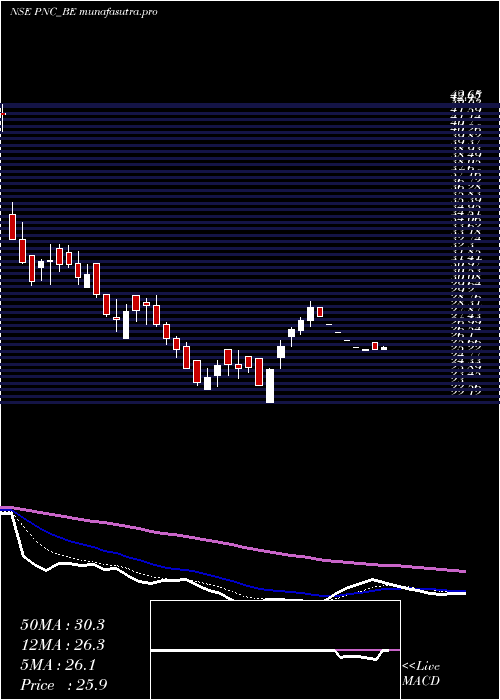
Daily price and volume Pritish Nandy
| Date |
Closing |
Open |
Range |
Volume |
Tue 28 October 2025 |
28.29 (-2.45%) |
29.00 |
28.20 - 29.95 |
1.1389 times |
Mon 27 October 2025 |
29.00 (-1.09%) |
30.69 |
27.85 - 30.78 |
1.4686 times |
Fri 24 October 2025 |
29.32 (-3.2%) |
30.29 |
29.11 - 30.29 |
0.1982 times |
Thu 23 October 2025 |
30.29 (-0.82%) |
30.60 |
29.40 - 30.60 |
0.8978 times |
Tue 21 October 2025 |
30.54 (4.73%) |
29.16 |
29.16 - 30.60 |
0.4085 times |
Mon 20 October 2025 |
29.16 (1.21%) |
28.81 |
28.40 - 30.25 |
0.7726 times |
Fri 17 October 2025 |
28.81 (-1.74%) |
30.05 |
28.80 - 30.78 |
2.0682 times |
Thu 16 October 2025 |
29.32 (-2.4%) |
30.04 |
29.06 - 31.39 |
1.2585 times |
Wed 15 October 2025 |
30.04 (-0.03%) |
29.03 |
29.03 - 30.05 |
0.6388 times |
Tue 14 October 2025 |
30.05 (-1.86%) |
31.00 |
29.60 - 31.00 |
1.1498 times |
Mon 13 October 2025 |
30.62 (0.36%) |
30.51 |
29.67 - 31.00 |
0.5818 times |
Weekly price and charts PritishNandy Strong weekly Stock price targets for PritishNandy PNC_BE are 26.61 and 29.54 | Weekly Target 1 | 26.04 | | Weekly Target 2 | 27.17 | | Weekly Target 3 | 28.973333333333 | | Weekly Target 4 | 30.1 | | Weekly Target 5 | 31.9 |
Weekly price and volumes for Pritish Nandy
| Date |
Closing |
Open |
Range |
Volume |
Tue 28 October 2025 |
28.29 (-3.51%) |
30.69 |
27.85 - 30.78 |
0.5922 times |
Fri 24 October 2025 |
29.32 (1.77%) |
28.81 |
28.40 - 30.60 |
0.5172 times |
Fri 17 October 2025 |
28.81 (-5.57%) |
30.51 |
28.80 - 31.39 |
1.294 times |
Fri 10 October 2025 |
30.51 (-1.1%) |
31.86 |
29.01 - 32.00 |
1.3047 times |
Fri 03 October 2025 |
30.85 (-2.56%) |
31.66 |
30.11 - 32.89 |
1.0245 times |
Fri 26 September 2025 |
31.66 (-9.05%) |
35.15 |
31.10 - 36.41 |
2.393 times |
Fri 19 September 2025 |
34.81 (27.32%) |
35.00 |
34.50 - 36.65 |
1.0583 times |
Fri 29 August 2025 |
27.34 (-2.84%) |
26.75 |
26.75 - 29.54 |
0.964 times |
Fri 22 August 2025 |
28.14 (0.72%) |
27.81 |
27.10 - 29.70 |
0.6436 times |
Thu 14 August 2025 |
27.94 (-3.29%) |
28.89 |
27.94 - 28.89 |
0.2085 times |
Fri 08 August 2025 |
28.89 (6.8%) |
27.10 |
27.10 - 28.89 |
0.4721 times |

Monthly price and charts PritishNandy Strong monthly Stock price targets for PritishNandy PNC_BE are 25.55 and 30.59 | Monthly Target 1 | 24.64 | | Monthly Target 2 | 26.46 | | Monthly Target 3 | 29.676666666667 | | Monthly Target 4 | 31.5 | | Monthly Target 5 | 34.72 |
Monthly price and volumes Pritish Nandy
| Date |
Closing |
Open |
Range |
Volume |
Tue 28 October 2025 |
28.29 (-8.74%) |
31.00 |
27.85 - 32.89 |
0.5199 times |
Tue 30 September 2025 |
31.00 (13.39%) |
35.00 |
30.11 - 36.65 |
0.4247 times |
Fri 29 August 2025 |
27.34 (3.09%) |
27.05 |
26.75 - 29.70 |
0.2647 times |
Thu 31 July 2025 |
26.52 (-2.32%) |
27.28 |
25.78 - 34.10 |
0.9369 times |
Mon 30 June 2025 |
27.15 (-5.2%) |
28.64 |
25.26 - 28.96 |
0.3394 times |
Fri 30 May 2025 |
28.64 (20.24%) |
23.80 |
23.15 - 30.30 |
0.5157 times |
Wed 30 April 2025 |
23.82 (-8.38%) |
26.65 |
23.34 - 29.05 |
0.4595 times |
Fri 28 March 2025 |
26.00 (-11.98%) |
29.54 |
22.12 - 29.54 |
6.0178 times |
Fri 28 February 2025 |
29.54 (-29.58%) |
35.05 |
29.35 - 35.90 |
0.3889 times |
Mon 05 December 2022 |
41.95 (-0.36%) |
42.85 |
40.75 - 43.00 |
0.1327 times |
Wed 30 November 2022 |
42.10 (-4.75%) |
45.20 |
40.20 - 45.75 |
0.6491 times |

DMA SMA EMA moving averages of Pritish Nandy PNC_BE
DMA (daily moving average) of Pritish Nandy PNC_BE
| DMA period | DMA value | | 5 day DMA | 29.49 | | 12 day DMA | 29.66 | | 20 day DMA | 30.18 | | 35 day DMA | 30.44 | | 50 day DMA | 29.62 | | 100 day DMA | 29.16 | | 150 day DMA | 28.12 | | 200 day DMA | 31.43 | EMA (exponential moving average) of Pritish Nandy PNC_BE
| EMA period | EMA current | EMA prev | EMA prev2 | | 5 day EMA | 29.1 | 29.5 | 29.75 | | 12 day EMA | 29.62 | 29.86 | 30.02 | | 20 day EMA | 29.91 | 30.08 | 30.19 | | 35 day EMA | 29.66 | 29.74 | 29.78 | | 50 day EMA | 29.47 | 29.52 | 29.54 |
SMA (simple moving average) of Pritish Nandy PNC_BE
| SMA period | SMA current | SMA prev | SMA prev2 | | 5 day SMA | 29.49 | 29.66 | 29.62 | | 12 day SMA | 29.66 | 29.81 | 29.94 | | 20 day SMA | 30.18 | 30.34 | 30.53 | | 35 day SMA | 30.44 | 30.45 | 30.42 | | 50 day SMA | 29.62 | 29.59 | 29.56 | | 100 day SMA | 29.16 | 29.16 | 29.14 | | 150 day SMA | 28.12 | 28.14 | 28.16 | | 200 day SMA | 31.43 | 31.52 | 31.6 |
|
|
