PnbGilts PNBGILTS full analysis,charts,indicators,moving averages,SMA,DMA,EMA,ADX,MACD,RSIPnb Gilts PNBGILTS WideScreen charts, DMA,SMA,EMA technical analysis, forecast prediction, by indicators ADX,MACD,RSI,CCI NSE stock exchange
operates under Finance (including NBFCs) sector
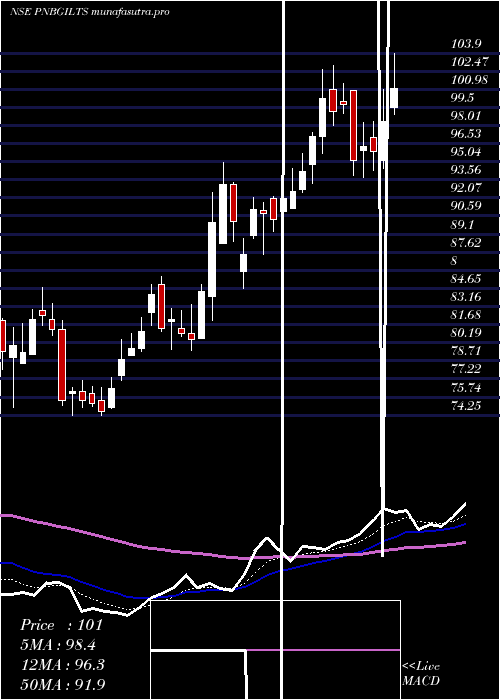
Daily price and charts and targets PnbGilts Strong Daily Stock price targets for PnbGilts PNBGILTS are 90.3 and 95.87 | Daily Target 1 | 86.22 | | Daily Target 2 | 88.81 | | Daily Target 3 | 91.793333333333 | | Daily Target 4 | 94.38 | | Daily Target 5 | 97.36 |
Daily price and volume Pnb Gilts
| Date |
Closing |
Open |
Range |
Volume |
Tue 28 October 2025 |
91.39 (3.04%) |
89.49 |
89.21 - 94.78 |
2.0082 times |
Mon 27 October 2025 |
88.69 (-1.48%) |
90.60 |
88.15 - 90.83 |
0.56 times |
Fri 24 October 2025 |
90.02 (-1.51%) |
91.85 |
89.52 - 91.85 |
0.6357 times |
Thu 23 October 2025 |
91.40 (-1.83%) |
93.85 |
91.11 - 94.00 |
0.6487 times |
Tue 21 October 2025 |
93.10 (1.05%) |
92.15 |
92.15 - 93.90 |
0.2606 times |
Mon 20 October 2025 |
92.13 (2.14%) |
90.20 |
89.77 - 92.60 |
0.9171 times |
Fri 17 October 2025 |
90.20 (-7.66%) |
91.00 |
88.79 - 92.35 |
3.0751 times |
Thu 16 October 2025 |
97.68 (1.1%) |
96.90 |
96.89 - 98.01 |
0.7123 times |
Wed 15 October 2025 |
96.62 (0.88%) |
96.50 |
96.06 - 97.48 |
0.5505 times |
Tue 14 October 2025 |
95.78 (-1.51%) |
97.06 |
95.30 - 98.55 |
0.6316 times |
Mon 13 October 2025 |
97.25 (-0.62%) |
97.20 |
96.00 - 98.00 |
0.6516 times |
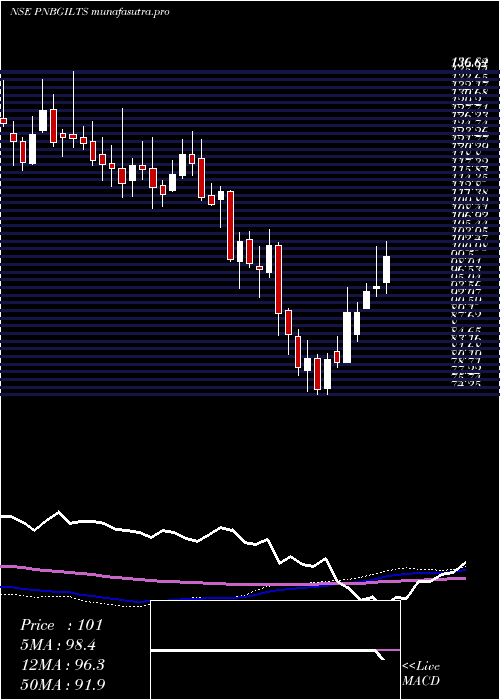
Weekly price and charts PnbGilts Strong weekly Stock price targets for PnbGilts PNBGILTS are 89.77 and 96.4 | Weekly Target 1 | 84.81 | | Weekly Target 2 | 88.1 | | Weekly Target 3 | 91.44 | | Weekly Target 4 | 94.73 | | Weekly Target 5 | 98.07 |
Weekly price and volumes for Pnb Gilts
| Date |
Closing |
Open |
Range |
Volume |
Tue 28 October 2025 |
91.39 (1.52%) |
90.60 |
88.15 - 94.78 |
0.7272 times |
Fri 24 October 2025 |
90.02 (-0.2%) |
90.20 |
89.52 - 94.00 |
0.6972 times |
Fri 17 October 2025 |
90.20 (-7.83%) |
97.20 |
88.79 - 98.55 |
1.5915 times |
Fri 10 October 2025 |
97.86 (-2.01%) |
99.87 |
96.50 - 100.82 |
0.6246 times |
Fri 03 October 2025 |
99.87 (3.74%) |
96.01 |
95.55 - 101.45 |
1.1124 times |
Fri 26 September 2025 |
96.27 (-7.41%) |
104.65 |
95.59 - 104.78 |
0.8882 times |
Fri 19 September 2025 |
103.98 (5.2%) |
98.84 |
98.84 - 106.00 |
1.2406 times |
Fri 12 September 2025 |
98.84 (1.19%) |
98.20 |
97.80 - 102.54 |
1.0432 times |
Fri 05 September 2025 |
97.68 (1.36%) |
96.85 |
96.71 - 101.70 |
0.9978 times |
Fri 29 August 2025 |
96.37 (-7.83%) |
105.00 |
95.70 - 105.51 |
1.0773 times |
Fri 22 August 2025 |
104.56 (0.23%) |
105.00 |
103.46 - 109.99 |
1.499 times |
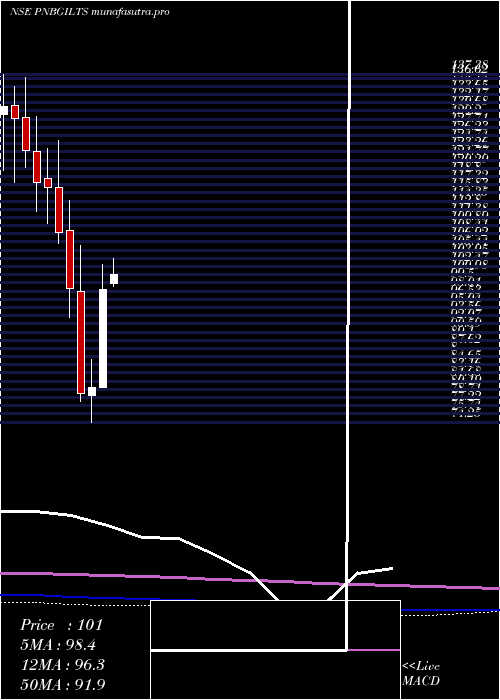
Monthly price and charts PnbGilts Strong monthly Stock price targets for PnbGilts PNBGILTS are 83.12 and 96.42 | Monthly Target 1 | 80.36 | | Monthly Target 2 | 85.88 | | Monthly Target 3 | 93.663333333333 | | Monthly Target 4 | 99.18 | | Monthly Target 5 | 106.96 |
Monthly price and volumes Pnb Gilts
| Date |
Closing |
Open |
Range |
Volume |
Tue 28 October 2025 |
91.39 (-5%) |
96.25 |
88.15 - 101.45 |
0.6464 times |
Tue 30 September 2025 |
96.20 (-0.18%) |
96.85 |
95.55 - 106.00 |
0.677 times |
Fri 29 August 2025 |
96.37 (-10.09%) |
107.35 |
95.70 - 109.99 |
1.0105 times |
Thu 31 July 2025 |
107.19 (7.73%) |
99.89 |
93.56 - 119.80 |
3.4372 times |
Mon 30 June 2025 |
99.50 (1.58%) |
97.99 |
91.41 - 104.80 |
0.9279 times |
Fri 30 May 2025 |
97.95 (-0.39%) |
99.45 |
87.00 - 103.90 |
0.7436 times |
Wed 30 April 2025 |
98.33 (22.16%) |
80.52 |
80.52 - 102.90 |
0.7944 times |
Fri 28 March 2025 |
80.49 (1.26%) |
79.01 |
74.25 - 85.60 |
0.6297 times |
Fri 28 February 2025 |
79.49 (-19.27%) |
97.91 |
78.01 - 106.31 |
0.573 times |
Fri 31 January 2025 |
98.47 (-9.29%) |
108.99 |
93.16 - 114.49 |
0.5605 times |
Tue 31 December 2024 |
108.56 (-7.09%) |
116.75 |
106.63 - 125.25 |
0.6229 times |
DMA SMA EMA moving averages of Pnb Gilts PNBGILTS
DMA (daily moving average) of Pnb Gilts PNBGILTS
| DMA period | DMA value | | 5 day DMA | 90.92 | | 12 day DMA | 93.51 | | 20 day DMA | 95.27 | | 35 day DMA | 97.54 | | 50 day DMA | 98.79 | | 100 day DMA | 99.69 | | 150 day DMA | 97.58 | | 200 day DMA | 96.21 | EMA (exponential moving average) of Pnb Gilts PNBGILTS
| EMA period | EMA current | EMA prev | EMA prev2 | | 5 day EMA | 91.04 | 90.86 | 91.94 | | 12 day EMA | 92.95 | 93.23 | 94.05 | | 20 day EMA | 94.58 | 94.92 | 95.57 | | 35 day EMA | 96.53 | 96.83 | 97.31 | | 50 day EMA | 98.29 | 98.57 | 98.97 |
SMA (simple moving average) of Pnb Gilts PNBGILTS
| SMA period | SMA current | SMA prev | SMA prev2 | | 5 day SMA | 90.92 | 91.07 | 91.37 | | 12 day SMA | 93.51 | 93.97 | 94.65 | | 20 day SMA | 95.27 | 95.52 | 96.01 | | 35 day SMA | 97.54 | 97.72 | 97.99 | | 50 day SMA | 98.79 | 99.02 | 99.28 | | 100 day SMA | 99.69 | 99.8 | 99.92 | | 150 day SMA | 97.58 | 97.5 | 97.41 | | 200 day SMA | 96.21 | 96.31 | 96.43 |
|
|
