PlatinumIndustries PLATIND full analysis,charts,indicators,moving averages,SMA,DMA,EMA,ADX,MACD,RSIPlatinum Industries PLATIND WideScreen charts, DMA,SMA,EMA technical analysis, forecast prediction, by indicators ADX,MACD,RSI,CCI NSE stock exchange
Daily price and charts and targets PlatinumIndustries Strong Daily Stock price targets for PlatinumIndustries PLATIND are 274.43 and 280.03 | Daily Target 1 | 270.15 | | Daily Target 2 | 273.1 | | Daily Target 3 | 275.75 | | Daily Target 4 | 278.7 | | Daily Target 5 | 281.35 |
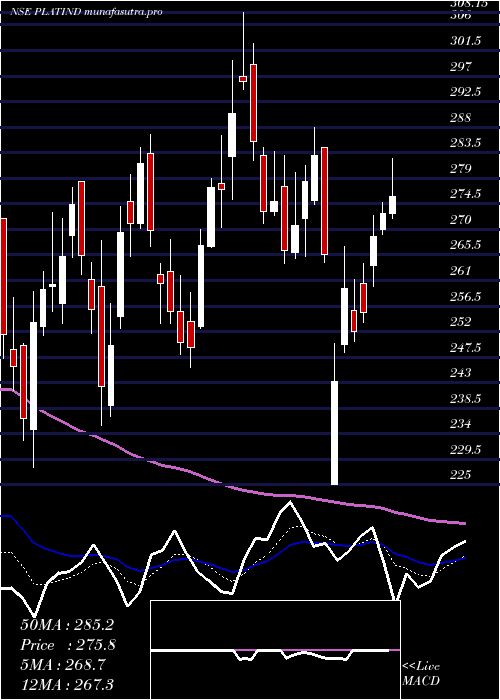
Daily price and volume Platinum Industries
| Date |
Closing |
Open |
Range |
Volume |
Wed 29 October 2025 |
276.05 (0.56%) |
275.50 |
272.80 - 278.40 |
0.4213 times |
Tue 28 October 2025 |
274.50 (0.46%) |
274.95 |
271.40 - 276.65 |
0.463 times |
Mon 27 October 2025 |
273.25 (1.3%) |
271.90 |
266.95 - 274.90 |
1.0202 times |
Fri 24 October 2025 |
269.75 (-3.28%) |
280.60 |
268.95 - 280.75 |
1.7456 times |
Thu 23 October 2025 |
278.90 (-5.63%) |
299.00 |
276.40 - 299.00 |
2.6474 times |
Tue 21 October 2025 |
295.55 (1.11%) |
294.40 |
294.20 - 297.55 |
0.4483 times |
Mon 20 October 2025 |
292.30 (3.52%) |
288.00 |
284.00 - 294.25 |
0.8985 times |
Fri 17 October 2025 |
282.35 (0.55%) |
281.25 |
277.80 - 285.00 |
0.7684 times |
Thu 16 October 2025 |
280.80 (-0.02%) |
284.90 |
278.85 - 287.65 |
0.8295 times |
Wed 15 October 2025 |
280.85 (1.41%) |
278.30 |
276.50 - 284.90 |
0.7578 times |
Tue 14 October 2025 |
276.95 (-2.59%) |
285.00 |
274.00 - 286.05 |
1.2051 times |
Weekly price and charts PlatinumIndustries Strong weekly Stock price targets for PlatinumIndustries PLATIND are 271.5 and 282.95 | Weekly Target 1 | 262.35 | | Weekly Target 2 | 269.2 | | Weekly Target 3 | 273.8 | | Weekly Target 4 | 280.65 | | Weekly Target 5 | 285.25 |
Weekly price and volumes for Platinum Industries
| Date |
Closing |
Open |
Range |
Volume |
Wed 29 October 2025 |
276.05 (2.34%) |
271.90 |
266.95 - 278.40 |
0.145 times |
Fri 24 October 2025 |
269.75 (-4.46%) |
288.00 |
268.95 - 299.00 |
0.4371 times |
Fri 17 October 2025 |
282.35 (-1.07%) |
287.20 |
274.00 - 287.65 |
0.3063 times |
Fri 10 October 2025 |
285.40 (-1.77%) |
292.70 |
281.00 - 297.00 |
0.3567 times |
Fri 03 October 2025 |
290.55 (-7.04%) |
313.85 |
289.00 - 314.85 |
0.3995 times |
Fri 26 September 2025 |
312.55 (-3.09%) |
321.70 |
304.15 - 328.10 |
0.9395 times |
Fri 19 September 2025 |
322.50 (16.78%) |
276.30 |
271.55 - 342.40 |
6.5259 times |
Fri 12 September 2025 |
276.15 (-3.56%) |
288.65 |
274.30 - 296.90 |
0.2989 times |
Fri 05 September 2025 |
286.35 (8.42%) |
265.90 |
261.00 - 294.95 |
0.4343 times |
Fri 29 August 2025 |
264.10 (-3.75%) |
274.95 |
261.00 - 281.00 |
0.1567 times |
Fri 22 August 2025 |
274.40 (-1.21%) |
284.10 |
272.75 - 284.10 |
0.1874 times |

Monthly price and charts PlatinumIndustries Strong monthly Stock price targets for PlatinumIndustries PLATIND are 254.85 and 288.15 | Monthly Target 1 | 247.78 | | Monthly Target 2 | 261.92 | | Monthly Target 3 | 281.08333333333 | | Monthly Target 4 | 295.22 | | Monthly Target 5 | 314.38 |
Monthly price and volumes Platinum Industries
| Date |
Closing |
Open |
Range |
Volume |
Wed 29 October 2025 |
276.05 (-5.83%) |
294.50 |
266.95 - 300.25 |
0.5322 times |
Tue 30 September 2025 |
293.15 (11%) |
265.90 |
261.00 - 342.40 |
3.1377 times |
Fri 29 August 2025 |
264.10 (-6.94%) |
283.05 |
261.00 - 293.45 |
0.2883 times |
Thu 31 July 2025 |
283.80 (3.22%) |
277.75 |
261.10 - 325.60 |
1.0887 times |
Mon 30 June 2025 |
274.95 (7.4%) |
254.00 |
251.10 - 306.55 |
0.7653 times |
Fri 30 May 2025 |
256.00 (1.87%) |
251.30 |
225.15 - 281.00 |
0.607 times |
Wed 30 April 2025 |
251.30 (-5.62%) |
266.00 |
225.00 - 288.00 |
0.5967 times |
Fri 28 March 2025 |
266.25 (4.06%) |
260.00 |
235.55 - 308.15 |
1.109 times |
Fri 28 February 2025 |
255.85 (-14.5%) |
303.90 |
228.00 - 311.25 |
0.6969 times |
Fri 31 January 2025 |
299.25 (-29.44%) |
434.10 |
281.30 - 444.00 |
1.1782 times |
Tue 31 December 2024 |
424.10 (-1.54%) |
433.65 |
411.00 - 502.05 |
2.6801 times |

DMA SMA EMA moving averages of Platinum Industries PLATIND
DMA (daily moving average) of Platinum Industries PLATIND
| DMA period | DMA value | | 5 day DMA | 274.49 | | 12 day DMA | 280.46 | | 20 day DMA | 284.17 | | 35 day DMA | 291.47 | | 50 day DMA | 286.12 | | 100 day DMA | 284.01 | | 150 day DMA | 277.42 | | 200 day DMA | 282.97 | EMA (exponential moving average) of Platinum Industries PLATIND
| EMA period | EMA current | EMA prev | EMA prev2 | | 5 day EMA | 276.56 | 276.81 | 277.96 | | 12 day EMA | 280.64 | 281.47 | 282.74 | | 20 day EMA | 283.74 | 284.55 | 285.61 | | 35 day EMA | 283.49 | 283.93 | 284.48 | | 50 day EMA | 284.06 | 284.39 | 284.79 |
SMA (simple moving average) of Platinum Industries PLATIND
| SMA period | SMA current | SMA prev | SMA prev2 | | 5 day SMA | 274.49 | 278.39 | 281.95 | | 12 day SMA | 280.46 | 281.24 | 282.62 | | 20 day SMA | 284.17 | 285.38 | 287.28 | | 35 day SMA | 291.47 | 291.79 | 292.13 | | 50 day SMA | 286.12 | 286.15 | 286.32 | | 100 day SMA | 284.01 | 284.1 | 284.02 | | 150 day SMA | 277.42 | 277.43 | 277.45 | | 200 day SMA | 282.97 | 283.69 | 284.39 |
|
|
