PlastiblendsIndia PLASTIBLEN full analysis,charts,indicators,moving averages,SMA,DMA,EMA,ADX,MACD,RSIPlastiblends India PLASTIBLEN WideScreen charts, DMA,SMA,EMA technical analysis, forecast prediction, by indicators ADX,MACD,RSI,CCI NSE stock exchange
operates under Specialty Chemicals sector
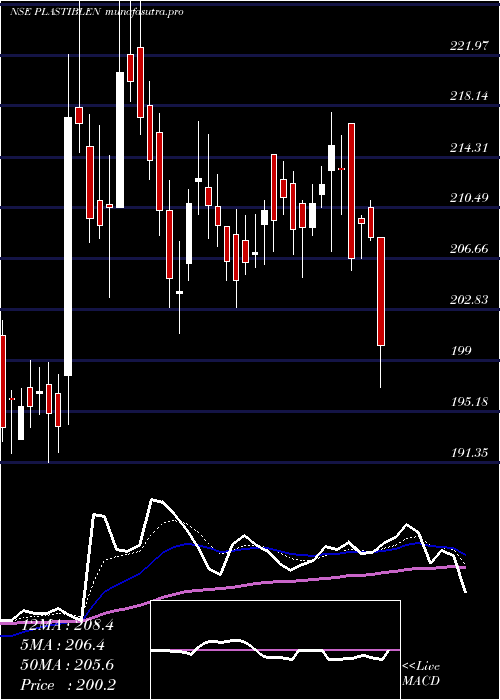
Daily price and charts and targets PlastiblendsIndia Strong Daily Stock price targets for PlastiblendsIndia PLASTIBLEN are 178.57 and 180.51 | Daily Target 1 | 177.04 | | Daily Target 2 | 178.16 | | Daily Target 3 | 178.98 | | Daily Target 4 | 180.1 | | Daily Target 5 | 180.92 |
Daily price and volume Plastiblends India
| Date |
Closing |
Open |
Range |
Volume |
Wed 29 October 2025 |
179.28 (0.5%) |
178.90 |
177.86 - 179.80 |
0.4072 times |
Tue 28 October 2025 |
178.38 (-0.56%) |
178.62 |
177.01 - 179.56 |
0.37 times |
Mon 27 October 2025 |
179.39 (0.17%) |
180.40 |
176.40 - 180.70 |
0.8277 times |
Fri 24 October 2025 |
179.09 (0.22%) |
180.40 |
177.95 - 180.79 |
0.5519 times |
Thu 23 October 2025 |
178.69 (0.55%) |
181.89 |
177.41 - 181.89 |
0.6846 times |
Tue 21 October 2025 |
177.71 (0.61%) |
176.63 |
176.39 - 179.00 |
0.2503 times |
Mon 20 October 2025 |
176.63 (-0.29%) |
177.15 |
175.51 - 182.90 |
0.8965 times |
Fri 17 October 2025 |
177.15 (-4.18%) |
181.55 |
176.00 - 184.95 |
3.5542 times |
Thu 16 October 2025 |
184.87 (0.4%) |
184.14 |
181.40 - 187.51 |
1.5529 times |
Wed 15 October 2025 |
184.14 (2.18%) |
182.11 |
179.00 - 184.34 |
0.9046 times |
Tue 14 October 2025 |
180.21 (0.12%) |
182.24 |
179.21 - 183.58 |
0.6812 times |
Weekly price and charts PlastiblendsIndia Strong weekly Stock price targets for PlastiblendsIndia PLASTIBLEN are 175.69 and 179.99 | Weekly Target 1 | 174.49 | | Weekly Target 2 | 176.89 | | Weekly Target 3 | 178.79333333333 | | Weekly Target 4 | 181.19 | | Weekly Target 5 | 183.09 |
Weekly price and volumes for Plastiblends India
| Date |
Closing |
Open |
Range |
Volume |
Wed 29 October 2025 |
179.28 (0.11%) |
180.40 |
176.40 - 180.70 |
0.3559 times |
Fri 24 October 2025 |
179.09 (1.1%) |
177.15 |
175.51 - 182.90 |
0.5285 times |
Fri 17 October 2025 |
177.15 (-3.52%) |
182.00 |
176.00 - 187.51 |
1.7917 times |
Fri 10 October 2025 |
183.62 (-2.54%) |
188.41 |
180.00 - 191.76 |
1.0709 times |
Fri 03 October 2025 |
188.41 (1.55%) |
186.75 |
180.00 - 189.02 |
0.7054 times |
Fri 26 September 2025 |
185.54 (-4.48%) |
196.75 |
185.20 - 196.75 |
0.8759 times |
Fri 19 September 2025 |
194.25 (-0.89%) |
197.00 |
190.00 - 199.00 |
1.4061 times |
Fri 12 September 2025 |
196.00 (0.6%) |
194.84 |
192.28 - 199.70 |
1.3042 times |
Fri 05 September 2025 |
194.84 (3.3%) |
190.69 |
187.03 - 196.00 |
1.5636 times |
Fri 29 August 2025 |
188.62 (-1.22%) |
190.95 |
187.30 - 194.98 |
0.3977 times |
Fri 22 August 2025 |
190.95 (1.46%) |
188.81 |
186.31 - 197.60 |
1.2529 times |
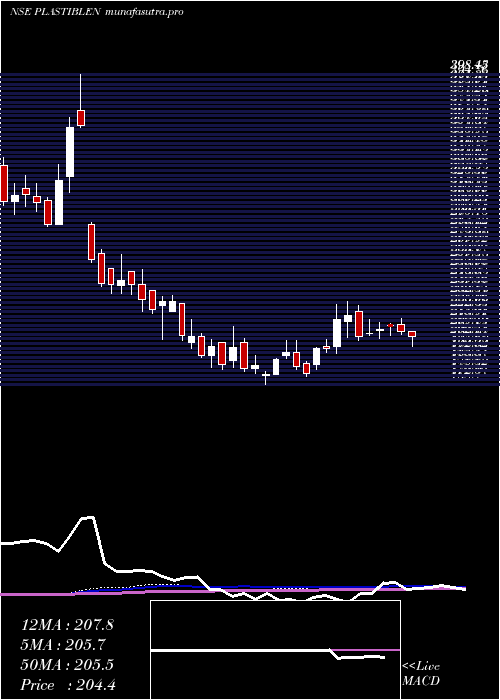
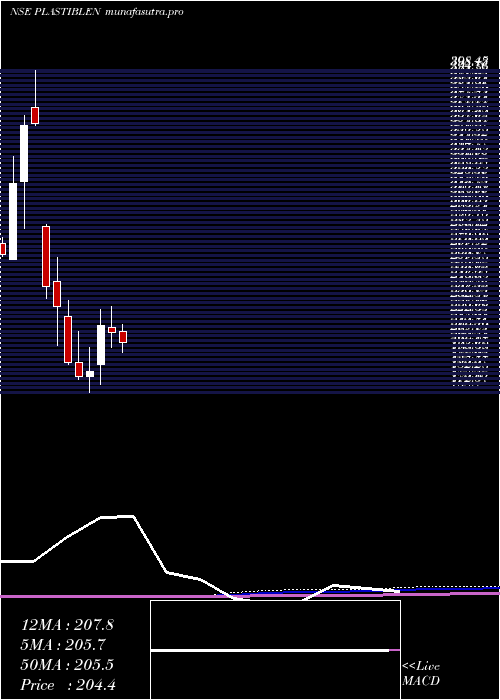
Monthly price and charts PlastiblendsIndia Strong monthly Stock price targets for PlastiblendsIndia PLASTIBLEN are 169.27 and 185.52 | Monthly Target 1 | 165.93 | | Monthly Target 2 | 172.61 | | Monthly Target 3 | 182.18333333333 | | Monthly Target 4 | 188.86 | | Monthly Target 5 | 198.43 |
Monthly price and volumes Plastiblends India
| Date |
Closing |
Open |
Range |
Volume |
Wed 29 October 2025 |
179.28 (-2.09%) |
184.88 |
175.51 - 191.76 |
0.53 times |
Tue 30 September 2025 |
183.11 (-2.92%) |
190.69 |
180.00 - 199.70 |
0.7049 times |
Fri 29 August 2025 |
188.62 (-0.2%) |
189.97 |
186.31 - 197.65 |
0.4975 times |
Thu 31 July 2025 |
188.99 (-10.54%) |
212.30 |
184.75 - 217.62 |
1.4133 times |
Mon 30 June 2025 |
211.25 (-2.58%) |
215.10 |
201.06 - 230.00 |
1.4522 times |
Fri 30 May 2025 |
216.85 (17.86%) |
188.45 |
174.22 - 228.33 |
1.2615 times |
Wed 30 April 2025 |
183.99 (2.12%) |
180.17 |
168.70 - 200.99 |
0.9446 times |
Fri 28 March 2025 |
180.17 (-5.16%) |
189.97 |
178.10 - 212.00 |
1.9016 times |
Fri 28 February 2025 |
189.97 (-17.35%) |
223.00 |
188.85 - 234.39 |
0.3758 times |
Fri 31 January 2025 |
229.85 (-5.9%) |
248.05 |
202.00 - 264.98 |
0.9186 times |
Tue 31 December 2024 |
244.27 (-32.29%) |
287.00 |
235.98 - 289.00 |
0.4956 times |
DMA SMA EMA moving averages of Plastiblends India PLASTIBLEN
DMA (daily moving average) of Plastiblends India PLASTIBLEN
| DMA period | DMA value | | 5 day DMA | 178.97 | | 12 day DMA | 179.63 | | 20 day DMA | 181.41 | | 35 day DMA | 185.96 | | 50 day DMA | 187.81 | | 100 day DMA | 195.1 | | 150 day DMA | 193.77 | | 200 day DMA | 198.73 | EMA (exponential moving average) of Plastiblends India PLASTIBLEN
| EMA period | EMA current | EMA prev | EMA prev2 | | 5 day EMA | 179.01 | 178.87 | 179.12 | | 12 day EMA | 180.02 | 180.15 | 180.47 | | 20 day EMA | 181.64 | 181.89 | 182.26 | | 35 day EMA | 184.22 | 184.51 | 184.87 | | 50 day EMA | 187.14 | 187.46 | 187.83 |
SMA (simple moving average) of Plastiblends India PLASTIBLEN
| SMA period | SMA current | SMA prev | SMA prev2 | | 5 day SMA | 178.97 | 178.65 | 178.3 | | 12 day SMA | 179.63 | 179.99 | 180.28 | | 20 day SMA | 181.41 | 181.57 | 181.93 | | 35 day SMA | 185.96 | 186.48 | 186.95 | | 50 day SMA | 187.81 | 187.98 | 188.25 | | 100 day SMA | 195.1 | 195.51 | 195.83 | | 150 day SMA | 193.77 | 193.9 | 194.06 | | 200 day SMA | 198.73 | 199.03 | 199.31 |
|
|
