PK PKTEA_BE full analysis,charts,indicators,moving averages,SMA,DMA,EMA,ADX,MACD,RSIP K PKTEA_BE WideScreen charts, DMA,SMA,EMA technical analysis, forecast prediction, by indicators ADX,MACD,RSI,CCI NSE stock exchange
Daily price and charts and targets PK Strong Daily Stock price targets for PK PKTEA_BE are 681.7 and 703.7 | Daily Target 1 | 665.13 | | Daily Target 2 | 676.27 | | Daily Target 3 | 687.13333333333 | | Daily Target 4 | 698.27 | | Daily Target 5 | 709.13 |
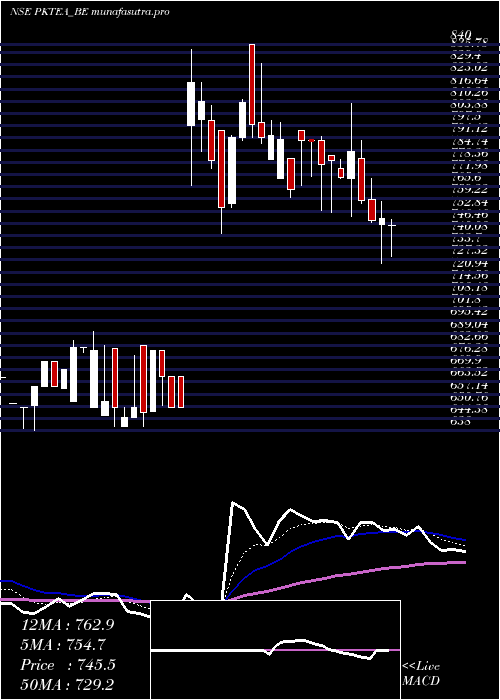
Daily price and volume P K
| Date |
Closing |
Open |
Range |
Volume |
Tue 28 October 2025 |
687.40 (-1.66%) |
676.00 |
676.00 - 698.00 |
0.2366 times |
Mon 27 October 2025 |
699.00 (-0.21%) |
700.00 |
676.00 - 700.00 |
0.8034 times |
Fri 24 October 2025 |
700.50 (0.21%) |
701.00 |
675.35 - 701.00 |
0.4879 times |
Thu 23 October 2025 |
699.00 (-0.29%) |
701.00 |
682.00 - 702.90 |
1.0399 times |
Tue 21 October 2025 |
701.00 (0.14%) |
701.00 |
701.00 - 701.00 |
1.7743 times |
Mon 20 October 2025 |
700.00 (-3.58%) |
701.00 |
699.00 - 704.50 |
2.3608 times |
Fri 17 October 2025 |
726.00 (0.12%) |
725.00 |
725.00 - 730.00 |
0.2119 times |
Thu 16 October 2025 |
725.10 (0%) |
725.10 |
703.10 - 725.10 |
0.2218 times |
Wed 15 October 2025 |
725.10 (-1.93%) |
730.00 |
720.00 - 730.00 |
0.0936 times |
Tue 14 October 2025 |
739.40 (-2.07%) |
765.00 |
720.00 - 765.00 |
2.7698 times |
Mon 13 October 2025 |
755.00 (-3.21%) |
773.00 |
741.00 - 779.20 |
6.6535 times |
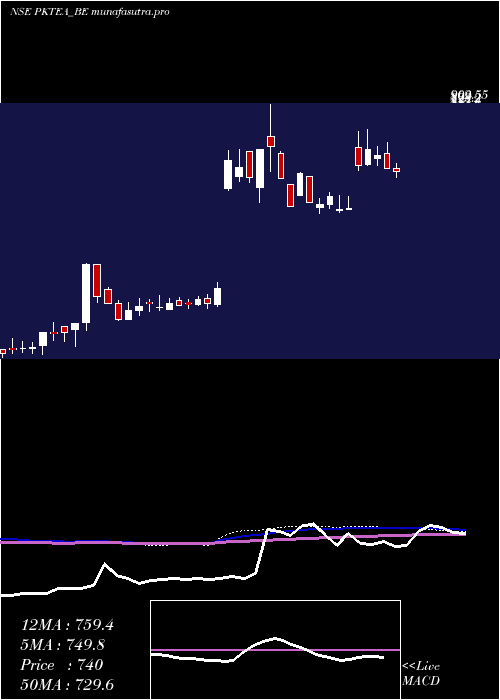
Weekly price and charts PK Strong weekly Stock price targets for PK PKTEA_BE are 669.7 and 693.7 | Weekly Target 1 | 663.8 | | Weekly Target 2 | 675.6 | | Weekly Target 3 | 687.8 | | Weekly Target 4 | 699.6 | | Weekly Target 5 | 711.8 |
Weekly price and volumes for P K
| Date |
Closing |
Open |
Range |
Volume |
Tue 28 October 2025 |
687.40 (-1.87%) |
700.00 |
676.00 - 700.00 |
0.0874 times |
Fri 24 October 2025 |
700.50 (-3.51%) |
701.00 |
675.35 - 704.50 |
0.4761 times |
Fri 17 October 2025 |
726.00 (-6.92%) |
773.00 |
703.10 - 779.20 |
0.8365 times |
Fri 10 October 2025 |
780.00 (-8.24%) |
854.25 |
780.00 - 854.25 |
0.4085 times |
Fri 03 October 2025 |
850.00 (-0.15%) |
860.00 |
803.00 - 888.00 |
0.4786 times |
Fri 26 September 2025 |
851.30 (4.39%) |
815.50 |
780.00 - 917.00 |
3.144 times |
Fri 19 September 2025 |
815.50 (7.64%) |
757.60 |
738.00 - 875.10 |
1.637 times |
Fri 12 September 2025 |
757.60 (-1.57%) |
768.95 |
735.00 - 779.40 |
1.2592 times |
Fri 05 September 2025 |
769.65 (2.75%) |
752.00 |
730.00 - 800.00 |
0.4686 times |
Fri 29 August 2025 |
749.05 (4.04%) |
719.95 |
702.00 - 752.85 |
1.2041 times |
Fri 22 August 2025 |
719.95 (9.68%) |
689.20 |
687.50 - 770.00 |
4.2204 times |
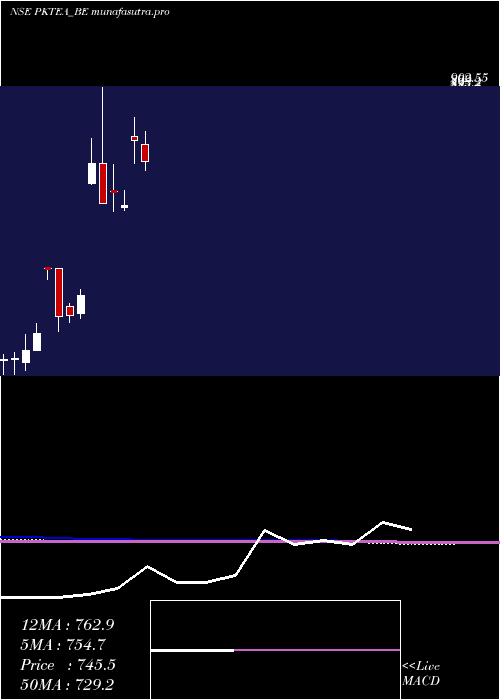
Monthly price and charts PK Strong monthly Stock price targets for PK PKTEA_BE are 580.55 and 782.2 | Monthly Target 1 | 544.93 | | Monthly Target 2 | 616.17 | | Monthly Target 3 | 746.58333333333 | | Monthly Target 4 | 817.82 | | Monthly Target 5 | 948.23 |
Monthly price and volumes P K
| Date |
Closing |
Open |
Range |
Volume |
Tue 28 October 2025 |
687.40 (-17.38%) |
832.00 |
675.35 - 877.00 |
0.3578 times |
Tue 30 September 2025 |
832.00 (11.07%) |
752.00 |
730.00 - 917.00 |
1.3044 times |
Fri 29 August 2025 |
749.05 (21.97%) |
615.45 |
567.20 - 770.00 |
1.4318 times |
Thu 31 July 2025 |
614.15 (-22.29%) |
780.30 |
585.00 - 809.10 |
1.0064 times |
Mon 30 June 2025 |
790.30 (21.58%) |
797.50 |
741.00 - 840.00 |
0.2895 times |
Thu 13 March 2025 |
650.00 (-4.41%) |
646.00 |
640.00 - 682.50 |
0.2037 times |
Fri 28 February 2025 |
680.00 (3.78%) |
681.70 |
638.00 - 737.80 |
0.9137 times |
Fri 31 January 2025 |
655.25 (-11.54%) |
740.70 |
654.10 - 902.55 |
1.9478 times |
Tue 31 December 2024 |
740.70 (61.67%) |
697.95 |
695.00 - 793.85 |
1.8578 times |
Fri 27 September 2024 |
458.15 (10.13%) |
420.00 |
408.30 - 470.90 |
0.6872 times |
Fri 30 August 2024 |
416.00 (0.58%) |
434.25 |
401.00 - 441.00 |
1.0811 times |
DMA SMA EMA moving averages of P K PKTEA_BE
DMA (daily moving average) of P K PKTEA_BE
| DMA period | DMA value | | 5 day DMA | 697.38 | | 12 day DMA | 719.79 | | 20 day DMA | 759.07 | | 35 day DMA | 778.33 | | 50 day DMA | 766.78 | | 100 day DMA | 735.71 | | 150 day DMA | 731.19 | | 200 day DMA | 660.09 | EMA (exponential moving average) of P K PKTEA_BE
| EMA period | EMA current | EMA prev | EMA prev2 | | 5 day EMA | 698.98 | 704.77 | 707.65 | | 12 day EMA | 722.05 | 728.35 | 733.69 | | 20 day EMA | 740.29 | 745.85 | 750.78 | | 35 day EMA | 744.63 | 748 | 750.88 | | 50 day EMA | 747.28 | 749.72 | 751.79 |
SMA (simple moving average) of P K PKTEA_BE
| SMA period | SMA current | SMA prev | SMA prev2 | | 5 day SMA | 697.38 | 699.9 | 705.3 | | 12 day SMA | 719.79 | 728.34 | 736.42 | | 20 day SMA | 759.07 | 767.27 | 776.73 | | 35 day SMA | 778.33 | 780.68 | 783.06 | | 50 day SMA | 766.78 | 765.54 | 763.96 | | 100 day SMA | 735.71 | 735.37 | 735.18 | | 150 day SMA | 731.19 | 731.71 | 732.15 | | 200 day SMA | 660.09 | 658.66 | 657.18 |
|
|
