PittiEngineering PITTIENG full analysis,charts,indicators,moving averages,SMA,DMA,EMA,ADX,MACD,RSIPitti Engineering PITTIENG WideScreen charts, DMA,SMA,EMA technical analysis, forecast prediction, by indicators ADX,MACD,RSI,CCI NSE stock exchange
operates under REAL_ESTATE_INVESTMENT_TRUST sector
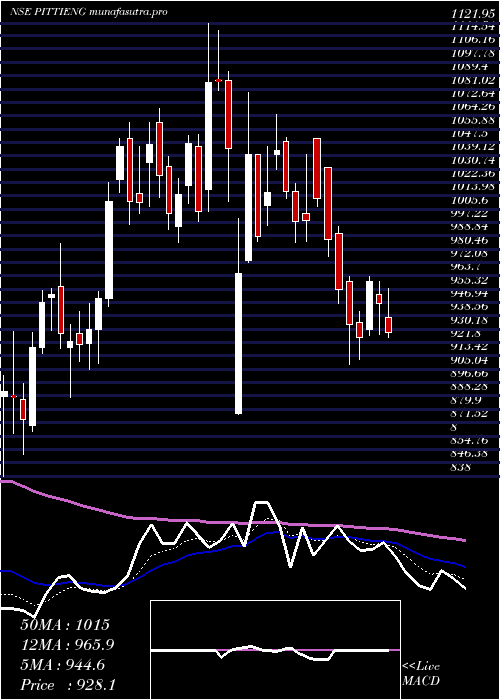
Daily price and charts and targets PittiEngineering Strong Daily Stock price targets for PittiEngineering PITTIENG are 939.18 and 948.38 | Daily Target 1 | 931.92 | | Daily Target 2 | 937.23 | | Daily Target 3 | 941.11666666667 | | Daily Target 4 | 946.43 | | Daily Target 5 | 950.32 |
Daily price and volume Pitti Engineering
| Date |
Closing |
Open |
Range |
Volume |
Tue 28 October 2025 |
942.55 (0.38%) |
939.00 |
935.80 - 945.00 |
0.4506 times |
Mon 27 October 2025 |
939.00 (0.34%) |
930.00 |
930.00 - 952.00 |
0.7882 times |
Fri 24 October 2025 |
935.85 (2.16%) |
925.20 |
914.55 - 949.00 |
2.438 times |
Thu 23 October 2025 |
916.05 (-1.13%) |
926.35 |
913.35 - 942.00 |
1.3276 times |
Tue 21 October 2025 |
926.55 (-0.55%) |
943.80 |
920.00 - 969.85 |
0.3875 times |
Mon 20 October 2025 |
931.70 (2.13%) |
918.20 |
910.10 - 935.00 |
0.646 times |
Fri 17 October 2025 |
912.30 (-1%) |
925.20 |
899.20 - 936.00 |
1.24 times |
Thu 16 October 2025 |
921.50 (-1.3%) |
933.65 |
918.00 - 943.50 |
1.6085 times |
Wed 15 October 2025 |
933.65 (-1.53%) |
948.15 |
930.50 - 952.50 |
0.4109 times |
Tue 14 October 2025 |
948.15 (0.26%) |
955.10 |
927.00 - 962.05 |
0.7026 times |
Mon 13 October 2025 |
945.70 (-2.28%) |
960.00 |
943.00 - 967.50 |
0.6053 times |
Weekly price and charts PittiEngineering Strong weekly Stock price targets for PittiEngineering PITTIENG are 936.28 and 958.28 | Weekly Target 1 | 919.52 | | Weekly Target 2 | 931.03 | | Weekly Target 3 | 941.51666666667 | | Weekly Target 4 | 953.03 | | Weekly Target 5 | 963.52 |
Weekly price and volumes for Pitti Engineering
| Date |
Closing |
Open |
Range |
Volume |
Tue 28 October 2025 |
942.55 (0.72%) |
930.00 |
930.00 - 952.00 |
0.2035 times |
Fri 24 October 2025 |
935.85 (2.58%) |
918.20 |
910.10 - 969.85 |
0.7883 times |
Fri 17 October 2025 |
912.30 (-5.73%) |
960.00 |
899.20 - 967.50 |
0.7502 times |
Fri 10 October 2025 |
967.75 (-2.74%) |
991.30 |
954.50 - 998.80 |
0.6965 times |
Fri 03 October 2025 |
995.05 (-1.49%) |
1010.05 |
968.00 - 1025.45 |
0.8669 times |
Fri 26 September 2025 |
1010.05 (0.35%) |
1000.00 |
979.55 - 1030.00 |
1.528 times |
Fri 19 September 2025 |
1006.50 (9.57%) |
915.00 |
909.45 - 1014.00 |
2.7848 times |
Fri 12 September 2025 |
918.60 (0.98%) |
909.70 |
861.90 - 925.00 |
1.3657 times |
Fri 05 September 2025 |
909.70 (-1.87%) |
927.05 |
900.00 - 932.00 |
0.5048 times |
Fri 29 August 2025 |
927.05 (-2.19%) |
957.30 |
908.25 - 957.35 |
0.5112 times |
Fri 22 August 2025 |
947.80 (-2.65%) |
973.00 |
939.15 - 984.15 |
1.0725 times |
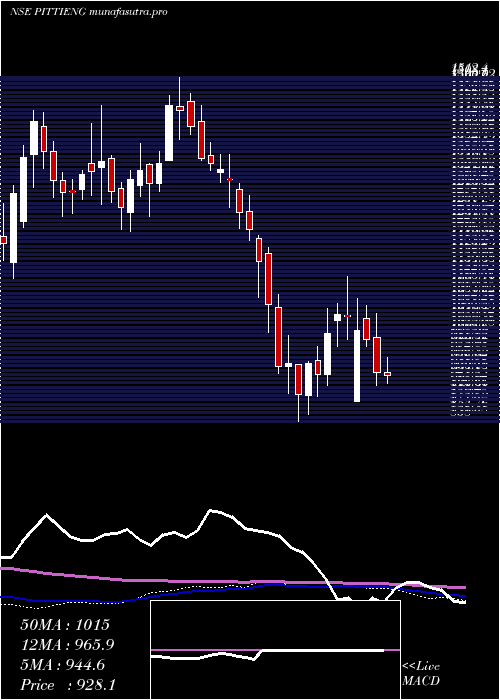
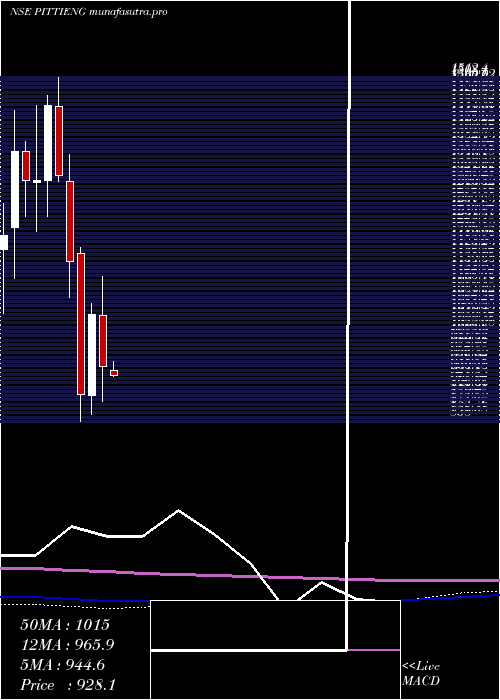
Monthly price and charts PittiEngineering Strong monthly Stock price targets for PittiEngineering PITTIENG are 863.3 and 978.45 | Monthly Target 1 | 836.88 | | Monthly Target 2 | 889.72 | | Monthly Target 3 | 952.03333333333 | | Monthly Target 4 | 1004.87 | | Monthly Target 5 | 1067.18 |
Monthly price and volumes Pitti Engineering
| Date |
Closing |
Open |
Range |
Volume |
Tue 28 October 2025 |
942.55 (-5.36%) |
990.40 |
899.20 - 1014.35 |
0.4174 times |
Tue 30 September 2025 |
995.90 (7.43%) |
927.05 |
861.90 - 1030.00 |
1.0286 times |
Fri 29 August 2025 |
927.05 (-1.77%) |
942.00 |
880.00 - 1000.00 |
0.6101 times |
Thu 31 July 2025 |
943.80 (-6.96%) |
1014.00 |
891.00 - 1044.40 |
1.5225 times |
Mon 30 June 2025 |
1014.35 (2.54%) |
989.20 |
938.00 - 1050.00 |
0.7709 times |
Fri 30 May 2025 |
989.20 (4.57%) |
937.40 |
871.15 - 1024.00 |
0.6585 times |
Wed 30 April 2025 |
946.00 (-9.65%) |
1045.00 |
877.00 - 1121.95 |
1.6177 times |
Fri 28 March 2025 |
1047.05 (17.51%) |
888.10 |
851.55 - 1068.85 |
1.0248 times |
Fri 28 February 2025 |
891.05 (-22.59%) |
1166.00 |
838.00 - 1177.95 |
1.3316 times |
Fri 31 January 2025 |
1151.05 (-12.76%) |
1309.00 |
1079.80 - 1361.00 |
1.018 times |
Tue 31 December 2024 |
1319.45 (-9.41%) |
1456.00 |
1308.00 - 1512.40 |
1.9183 times |
DMA SMA EMA moving averages of Pitti Engineering PITTIENG
DMA (daily moving average) of Pitti Engineering PITTIENG
| DMA period | DMA value | | 5 day DMA | 932 | | 12 day DMA | 935.06 | | 20 day DMA | 955.4 | | 35 day DMA | 957.89 | | 50 day DMA | 951.99 | | 100 day DMA | 960.29 | | 150 day DMA | 969.68 | | 200 day DMA | 995.81 | EMA (exponential moving average) of Pitti Engineering PITTIENG
| EMA period | EMA current | EMA prev | EMA prev2 | | 5 day EMA | 935.65 | 932.2 | 928.8 | | 12 day EMA | 940.04 | 939.58 | 939.69 | | 20 day EMA | 946.69 | 947.13 | 947.98 | | 35 day EMA | 947.56 | 947.86 | 948.38 | | 50 day EMA | 948.34 | 948.58 | 948.97 |
SMA (simple moving average) of Pitti Engineering PITTIENG
| SMA period | SMA current | SMA prev | SMA prev2 | | 5 day SMA | 932 | 929.83 | 924.49 | | 12 day SMA | 935.06 | 937.62 | 940.29 | | 20 day SMA | 955.4 | 958.77 | 962.32 | | 35 day SMA | 957.89 | 956.95 | 956.04 | | 50 day SMA | 951.99 | 952.44 | 952.72 | | 100 day SMA | 960.29 | 961.05 | 961.4 | | 150 day SMA | 969.68 | 970.36 | 970.84 | | 200 day SMA | 995.81 | 997.63 | 999.59 |
|
|
