PowerInstrument PIGL full analysis,charts,indicators,moving averages,SMA,DMA,EMA,ADX,MACD,RSIPower Instrument PIGL WideScreen charts, DMA,SMA,EMA technical analysis, forecast prediction, by indicators ADX,MACD,RSI,CCI NSE stock exchange
operates under REAL_ESTATE_INVESTMENT_TRUST sector
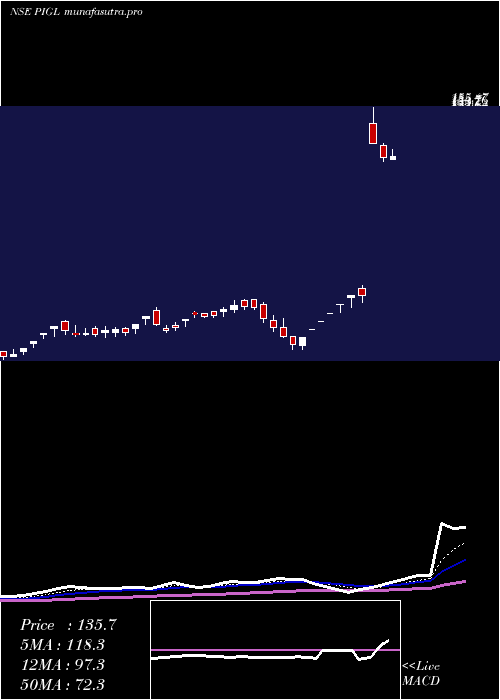
Daily price and charts and targets PowerInstrument Strong Daily Stock price targets for PowerInstrument PIGL are 134.92 and 139.06 | Daily Target 1 | 131.9 | | Daily Target 2 | 133.8 | | Daily Target 3 | 136.04333333333 | | Daily Target 4 | 137.94 | | Daily Target 5 | 140.18 |
Daily price and volume Power Instrument
| Date |
Closing |
Open |
Range |
Volume |
Wed 10 December 2025 |
135.69 (0.53%) |
134.15 |
134.15 - 138.29 |
0.2314 times |
Tue 09 December 2025 |
134.97 (-4.05%) |
140.10 |
133.70 - 140.99 |
0.5908 times |
Mon 08 December 2025 |
140.66 (78.28%) |
149.00 |
140.66 - 155.47 |
0.9466 times |
Thu 22 February 2024 |
78.90 (-0.25%) |
81.75 |
76.10 - 83.00 |
1.7681 times |
Wed 21 February 2024 |
79.10 (4.98%) |
78.20 |
74.25 - 79.10 |
3.1565 times |
Tue 20 February 2024 |
75.35 (4.94%) |
75.35 |
72.00 - 75.35 |
2.4002 times |
Mon 19 February 2024 |
71.80 (4.97%) |
71.80 |
71.80 - 71.80 |
0.1642 times |
Fri 16 February 2024 |
68.40 (4.99%) |
68.40 |
68.40 - 68.40 |
0.0792 times |
Thu 15 February 2024 |
65.15 (5%) |
65.15 |
65.15 - 65.15 |
0.1001 times |
Wed 14 February 2024 |
62.05 (4.99%) |
58.80 |
57.15 - 62.05 |
0.563 times |
Tue 13 February 2024 |
59.10 (-5.06%) |
62.20 |
57.05 - 62.25 |
0.2484 times |
Weekly price and charts PowerInstrument Strong weekly Stock price targets for PowerInstrument PIGL are 123.81 and 145.58 | Weekly Target 1 | 119.85 | | Weekly Target 2 | 127.77 | | Weekly Target 3 | 141.62 | | Weekly Target 4 | 149.54 | | Weekly Target 5 | 163.39 |
Weekly price and volumes for Power Instrument
| Date |
Closing |
Open |
Range |
Volume |
Wed 10 December 2025 |
135.69 (71.98%) |
149.00 |
133.70 - 155.47 |
0.5138 times |
Thu 22 February 2024 |
78.90 (15.35%) |
71.80 |
71.80 - 83.00 |
2.1756 times |
Fri 16 February 2024 |
68.40 (3.71%) |
66.10 |
57.05 - 69.70 |
0.3914 times |
Fri 09 February 2024 |
65.95 (-10.09%) |
73.50 |
64.55 - 77.45 |
1.0031 times |
Fri 02 February 2024 |
73.35 (10.88%) |
68.70 |
66.35 - 74.25 |
0.6529 times |
Thu 25 January 2024 |
66.15 (-1.56%) |
69.90 |
64.05 - 74.05 |
0.7395 times |
Fri 19 January 2024 |
67.20 (5.41%) |
65.60 |
62.10 - 67.40 |
1.0095 times |
Fri 12 January 2024 |
63.75 (5.46%) |
63.15 |
61.75 - 68.70 |
1.5176 times |
Fri 05 January 2024 |
60.45 (15.58%) |
54.80 |
53.00 - 60.45 |
1.1855 times |
Fri 29 December 2023 |
52.30 (8.06%) |
49.20 |
47.40 - 52.30 |
0.811 times |
Fri 22 December 2023 |
48.40 (4.09%) |
47.00 |
43.20 - 49.00 |
0.501 times |

Monthly price and charts PowerInstrument Strong monthly Stock price targets for PowerInstrument PIGL are 123.81 and 145.58 | Monthly Target 1 | 119.85 | | Monthly Target 2 | 127.77 | | Monthly Target 3 | 141.62 | | Monthly Target 4 | 149.54 | | Monthly Target 5 | 163.39 |
Monthly price and volumes Power Instrument
| Date |
Closing |
Open |
Range |
Volume |
Wed 10 December 2025 |
135.69 (71.98%) |
149.00 |
133.70 - 155.47 |
0.1676 times |
Thu 22 February 2024 |
78.90 (12.07%) |
72.60 |
57.05 - 83.00 |
1.2588 times |
Wed 31 January 2024 |
70.40 (34.61%) |
54.80 |
53.00 - 74.05 |
1.5701 times |
Fri 29 December 2023 |
52.30 (25.12%) |
47.25 |
43.20 - 52.30 |
0.619 times |
Fri 30 June 2023 |
41.80 (-44.6%) |
71.70 |
41.80 - 78.70 |
3.8461 times |
Wed 31 May 2023 |
75.45 (528.75%) |
93.45 |
70.20 - 93.45 |
1.4425 times |
Fri 19 October 2018 |
12.00 (-40%) |
12.00 |
12.00 - 12.00 |
0.0031 times |
Fri 08 June 2018 |
20.00 (-26.61%) |
22.15 |
20.00 - 22.15 |
0.0184 times |
Thu 31 May 2018 |
27.25 (-14.04%) |
31.50 |
23.50 - 32.40 |
0.2793 times |
Fri 27 April 2018 |
31.70 (0%) |
35.00 |
30.90 - 35.90 |
0.795 times |
Wed 10 December 2025 |
(0%) |
|
- |
0 times |

DMA SMA EMA moving averages of Power Instrument PIGL
DMA (daily moving average) of Power Instrument PIGL
| DMA period | DMA value | | 5 day DMA | 113.86 | | 12 day DMA | 86.12 | | 20 day DMA | 80.39 | | 35 day DMA | 74.29 | | 50 day DMA | 67.53 | | 100 day DMA | 60.45 | | 150 day DMA | | | 200 day DMA | | EMA (exponential moving average) of Power Instrument PIGL
| EMA period | EMA current | EMA prev | EMA prev2 | | 5 day EMA | 118.31 | 109.62 | 96.94 | | 12 day EMA | 97.3 | 90.32 | 82.2 | | 20 day EMA | 87.08 | 81.96 | 76.38 | | 35 day EMA | 76.81 | 73.34 | 69.71 | | 50 day EMA | 70.6 | 67.94 | 65.21 |
SMA (simple moving average) of Power Instrument PIGL
| SMA period | SMA current | SMA prev | SMA prev2 | | 5 day SMA | 113.86 | 101.8 | 89.16 | | 12 day SMA | 86.12 | 80.31 | 74.88 | | 20 day SMA | 80.39 | 77.19 | 73.9 | | 35 day SMA | 74.29 | 72.23 | 70.1 | | 50 day SMA | 67.53 | 65.74 | 63.95 | | 100 day SMA | 60.45 | 59.36 | 58.3 | | 150 day SMA | | 200 day SMA |
|
|
