PowergridInfra PGINVIT_IV full analysis,charts,indicators,moving averages,SMA,DMA,EMA,ADX,MACD,RSIPowergrid Infra PGINVIT_IV WideScreen charts, DMA,SMA,EMA technical analysis, forecast prediction, by indicators ADX,MACD,RSI,CCI NSE stock exchange
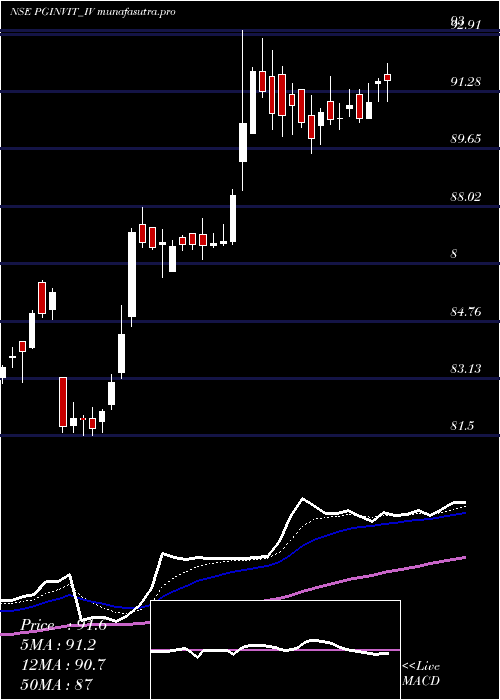
Daily price and charts and targets PowergridInfra Strong Daily Stock price targets for PowergridInfra PGINVIT_IV are 96.4 and 97.95 | Daily Target 1 | 95.21 | | Daily Target 2 | 96.03 | | Daily Target 3 | 96.763333333333 | | Daily Target 4 | 97.58 | | Daily Target 5 | 98.31 |
Daily price and volume Powergrid Infra
| Date |
Closing |
Open |
Range |
Volume |
Tue 28 October 2025 |
96.84 (1.01%) |
96.04 |
95.95 - 97.50 |
1.2541 times |
Mon 27 October 2025 |
95.87 (0.5%) |
95.99 |
95.55 - 96.05 |
1.075 times |
Fri 24 October 2025 |
95.39 (-0.63%) |
96.27 |
95.09 - 96.27 |
1.328 times |
Thu 23 October 2025 |
95.99 (0.47%) |
96.00 |
95.74 - 96.24 |
0.8394 times |
Tue 21 October 2025 |
95.54 (-0.48%) |
96.33 |
95.00 - 96.48 |
1.0871 times |
Mon 20 October 2025 |
96.00 (0.23%) |
96.40 |
95.57 - 96.49 |
1.14 times |
Fri 17 October 2025 |
95.78 (-0.17%) |
96.00 |
95.60 - 96.33 |
0.8922 times |
Thu 16 October 2025 |
95.94 (0.48%) |
95.58 |
95.22 - 96.41 |
0.7375 times |
Wed 15 October 2025 |
95.48 (0.22%) |
95.15 |
94.99 - 95.60 |
0.6866 times |
Tue 14 October 2025 |
95.27 (-0.26%) |
95.85 |
94.76 - 96.00 |
0.9601 times |
Mon 13 October 2025 |
95.52 (0.33%) |
95.48 |
95.11 - 95.69 |
1.0004 times |
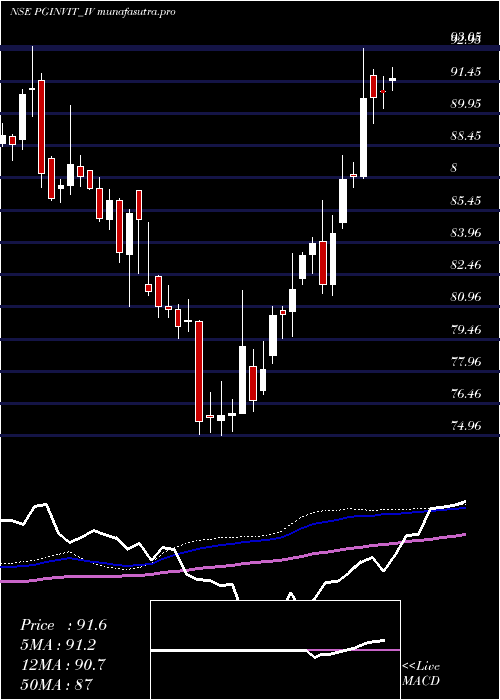
Weekly price and charts PowergridInfra Strong weekly Stock price targets for PowergridInfra PGINVIT_IV are 96.2 and 98.15 | Weekly Target 1 | 94.68 | | Weekly Target 2 | 95.76 | | Weekly Target 3 | 96.63 | | Weekly Target 4 | 97.71 | | Weekly Target 5 | 98.58 |
Weekly price and volumes for Powergrid Infra
| Date |
Closing |
Open |
Range |
Volume |
Tue 28 October 2025 |
96.84 (1.52%) |
95.99 |
95.55 - 97.50 |
0.5019 times |
Fri 24 October 2025 |
95.39 (-0.41%) |
96.40 |
95.00 - 96.49 |
0.947 times |
Fri 17 October 2025 |
95.78 (0.6%) |
95.48 |
94.76 - 96.41 |
0.9217 times |
Fri 10 October 2025 |
95.21 (0.16%) |
95.40 |
94.25 - 95.42 |
0.8439 times |
Fri 03 October 2025 |
95.06 (-0.02%) |
95.03 |
94.02 - 95.94 |
0.8531 times |
Fri 26 September 2025 |
95.08 (-1.43%) |
96.90 |
94.45 - 96.90 |
1.0514 times |
Fri 19 September 2025 |
96.46 (-0.02%) |
96.50 |
95.20 - 97.40 |
0.9947 times |
Fri 12 September 2025 |
96.48 (5.22%) |
91.89 |
91.56 - 96.90 |
1.4806 times |
Fri 05 September 2025 |
91.69 (0.94%) |
91.00 |
90.84 - 91.75 |
1.0471 times |
Fri 29 August 2025 |
90.84 (-0.47%) |
91.39 |
90.51 - 91.98 |
1.3584 times |
Fri 22 August 2025 |
91.27 (0.41%) |
91.48 |
90.20 - 91.75 |
1.5148 times |
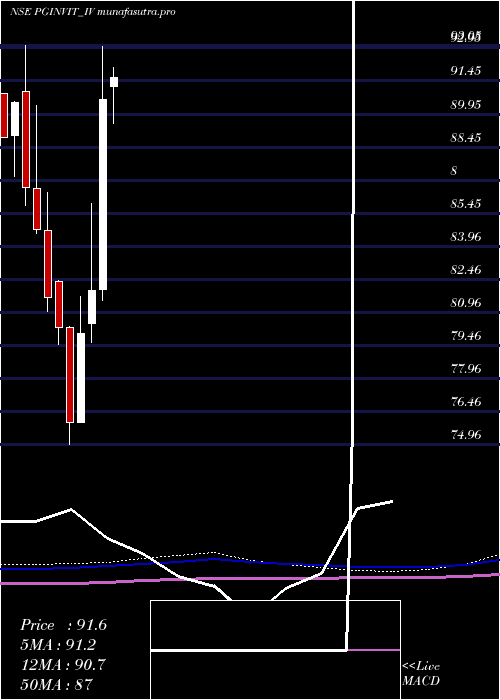
Monthly price and charts PowergridInfra Strong monthly Stock price targets for PowergridInfra PGINVIT_IV are 95.55 and 98.8 | Monthly Target 1 | 92.95 | | Monthly Target 2 | 94.89 | | Monthly Target 3 | 96.196666666667 | | Monthly Target 4 | 98.14 | | Monthly Target 5 | 99.45 |
Monthly price and volumes Powergrid Infra
| Date |
Closing |
Open |
Range |
Volume |
Tue 28 October 2025 |
96.84 (1.59%) |
95.77 |
94.25 - 97.50 |
0.4735 times |
Tue 30 September 2025 |
95.32 (4.93%) |
91.00 |
90.84 - 97.40 |
0.6446 times |
Fri 29 August 2025 |
90.84 (-0.74%) |
91.80 |
90.01 - 94.45 |
0.6854 times |
Thu 31 July 2025 |
91.52 (1%) |
91.20 |
89.51 - 94.50 |
0.7272 times |
Mon 30 June 2025 |
90.61 (10.53%) |
82.00 |
81.50 - 93.00 |
1.1034 times |
Fri 30 May 2025 |
81.98 (2.45%) |
80.48 |
79.60 - 85.90 |
1.0596 times |
Wed 30 April 2025 |
80.02 (5.3%) |
76.00 |
76.00 - 81.70 |
1.1142 times |
Fri 28 March 2025 |
75.99 (-5.37%) |
80.29 |
74.96 - 80.34 |
2.1691 times |
Fri 28 February 2025 |
80.30 (-1.67%) |
82.35 |
79.51 - 82.40 |
1.2228 times |
Fri 31 January 2025 |
81.66 (-3.6%) |
84.67 |
81.00 - 86.40 |
0.8001 times |
Tue 31 December 2024 |
84.71 (-2.21%) |
86.60 |
84.55 - 90.35 |
0.7483 times |
DMA SMA EMA moving averages of Powergrid Infra PGINVIT_IV
DMA (daily moving average) of Powergrid Infra PGINVIT_IV
| DMA period | DMA value | | 5 day DMA | 95.93 | | 12 day DMA | 95.74 | | 20 day DMA | 95.41 | | 35 day DMA | 95.47 | | 50 day DMA | 94.17 | | 100 day DMA | 92.32 | | 150 day DMA | 88.31 | | 200 day DMA | 86.49 | EMA (exponential moving average) of Powergrid Infra PGINVIT_IV
| EMA period | EMA current | EMA prev | EMA prev2 | | 5 day EMA | 96.09 | 95.72 | 95.65 | | 12 day EMA | 95.77 | 95.58 | 95.53 | | 20 day EMA | 95.51 | 95.37 | 95.32 | | 35 day EMA | 94.78 | 94.66 | 94.59 | | 50 day EMA | 94.15 | 94.04 | 93.97 |
SMA (simple moving average) of Powergrid Infra PGINVIT_IV
| SMA period | SMA current | SMA prev | SMA prev2 | | 5 day SMA | 95.93 | 95.76 | 95.74 | | 12 day SMA | 95.74 | 95.56 | 95.46 | | 20 day SMA | 95.41 | 95.32 | 95.25 | | 35 day SMA | 95.47 | 95.32 | 95.19 | | 50 day SMA | 94.17 | 94.04 | 93.96 | | 100 day SMA | 92.32 | 92.18 | 92.03 | | 150 day SMA | 88.31 | 88.17 | 88.04 | | 200 day SMA | 86.49 | 86.44 | 86.39 |
|
|
