Pfizer PFIZER full analysis,charts,indicators,moving averages,SMA,DMA,EMA,ADX,MACD,RSIPfizer PFIZER WideScreen charts, DMA,SMA,EMA technical analysis, forecast prediction, by indicators ADX,MACD,RSI,CCI NSE stock exchange
operates under Pharmaceuticals sector
Daily price and charts and targets Pfizer Strong Daily Stock price targets for Pfizer PFIZER are 5227 and 5286.5 | Daily Target 1 | 5212.83 | | Daily Target 2 | 5241.17 | | Daily Target 3 | 5272.3333333333 | | Daily Target 4 | 5300.67 | | Daily Target 5 | 5331.83 |
Daily price and volume Pfizer
| Date |
Closing |
Open |
Range |
Volume |
Wed 29 October 2025 |
5269.50 (-0.4%) |
5300.00 |
5244.00 - 5303.50 |
0.5029 times |
Tue 28 October 2025 |
5290.50 (-0.35%) |
5300.00 |
5226.00 - 5324.50 |
0.7099 times |
Mon 27 October 2025 |
5309.00 (-0.6%) |
5341.00 |
5270.00 - 5343.00 |
0.8768 times |
Fri 24 October 2025 |
5341.00 (0.82%) |
5255.00 |
5254.50 - 5357.00 |
0.9625 times |
Thu 23 October 2025 |
5297.50 (-1.01%) |
5351.50 |
5279.00 - 5446.00 |
1.7706 times |
Tue 21 October 2025 |
5351.50 (0.51%) |
5356.00 |
5300.00 - 5400.00 |
0.1174 times |
Mon 20 October 2025 |
5324.50 (-0.55%) |
5354.00 |
5300.50 - 5397.50 |
1.2444 times |
Fri 17 October 2025 |
5354.00 (0.61%) |
5325.00 |
5249.00 - 5399.50 |
1.4342 times |
Thu 16 October 2025 |
5321.50 (-0.25%) |
5349.50 |
5301.00 - 5370.50 |
1.6175 times |
Wed 15 October 2025 |
5335.00 (-1.02%) |
5390.00 |
5320.50 - 5431.50 |
0.7637 times |
Tue 14 October 2025 |
5390.00 (-2.52%) |
5498.00 |
5366.50 - 5540.00 |
1.4983 times |
Weekly price and charts Pfizer Strong weekly Stock price targets for Pfizer PFIZER are 5189.25 and 5306.25 | Weekly Target 1 | 5162.5 | | Weekly Target 2 | 5216 | | Weekly Target 3 | 5279.5 | | Weekly Target 4 | 5333 | | Weekly Target 5 | 5396.5 |
Weekly price and volumes for Pfizer
| Date |
Closing |
Open |
Range |
Volume |
Wed 29 October 2025 |
5269.50 (-1.34%) |
5341.00 |
5226.00 - 5343.00 |
0.2278 times |
Fri 24 October 2025 |
5341.00 (-0.24%) |
5354.00 |
5254.50 - 5446.00 |
0.4464 times |
Fri 17 October 2025 |
5354.00 (0.39%) |
5270.00 |
5249.00 - 5578.50 |
1.0205 times |
Fri 10 October 2025 |
5333.00 (2.12%) |
5269.00 |
5159.50 - 5340.00 |
0.6207 times |
Fri 03 October 2025 |
5222.50 (5.91%) |
4933.00 |
4857.50 - 5442.00 |
3.8496 times |
Fri 26 September 2025 |
4931.00 (-3.46%) |
5150.00 |
4770.50 - 5174.00 |
0.5898 times |
Fri 19 September 2025 |
5107.50 (-2.29%) |
5227.00 |
5095.50 - 5250.00 |
0.5773 times |
Fri 12 September 2025 |
5227.00 (2.13%) |
5118.00 |
5082.50 - 5292.00 |
0.7445 times |
Fri 05 September 2025 |
5118.00 (-0.74%) |
5200.00 |
5079.50 - 5269.50 |
0.7759 times |
Fri 29 August 2025 |
5156.00 (-9.04%) |
5670.50 |
5105.50 - 5697.50 |
1.1475 times |
Fri 22 August 2025 |
5668.50 (6.39%) |
5400.00 |
5354.50 - 5873.50 |
4.9165 times |
Monthly price and charts Pfizer Strong monthly Stock price targets for Pfizer PFIZER are 5185.25 and 5662.75 | Monthly Target 1 | 4838.83 | | Monthly Target 2 | 5054.17 | | Monthly Target 3 | 5316.3333333333 | | Monthly Target 4 | 5531.67 | | Monthly Target 5 | 5793.83 |
Monthly price and volumes Pfizer
| Date |
Closing |
Open |
Range |
Volume |
Wed 29 October 2025 |
5269.50 (4.64%) |
5200.00 |
5101.00 - 5578.50 |
0.7023 times |
Tue 30 September 2025 |
5036.00 (-2.33%) |
5200.00 |
4770.50 - 5292.00 |
0.3545 times |
Fri 29 August 2025 |
5156.00 (-0.74%) |
5246.00 |
4915.00 - 5873.50 |
1.3343 times |
Thu 31 July 2025 |
5194.50 (-8.51%) |
5749.00 |
5179.00 - 5896.00 |
0.8432 times |
Mon 30 June 2025 |
5677.50 (1.14%) |
5590.00 |
5443.00 - 5993.00 |
0.7624 times |
Fri 30 May 2025 |
5613.30 (30.76%) |
4310.50 |
4100.10 - 5671.30 |
2.416 times |
Wed 30 April 2025 |
4292.80 (7.2%) |
3992.50 |
3701.00 - 4365.00 |
0.4211 times |
Fri 28 March 2025 |
4004.50 (-1.14%) |
4130.00 |
3865.00 - 4196.00 |
0.6297 times |
Fri 28 February 2025 |
4050.75 (-10.74%) |
4575.00 |
3910.00 - 4575.00 |
1.8924 times |
Fri 31 January 2025 |
4538.20 (-14.07%) |
5270.00 |
4413.05 - 5544.00 |
0.6441 times |
Tue 31 December 2024 |
5281.50 (-0.6%) |
5314.00 |
4601.00 - 5469.00 |
1.1319 times |
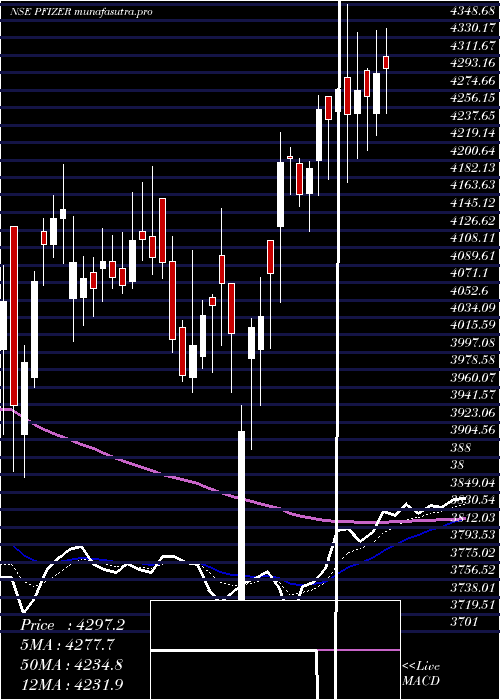
DMA SMA EMA moving averages of Pfizer PFIZER
DMA (daily moving average) of Pfizer PFIZER
| DMA period | DMA value | | 5 day DMA | 5301.5 | | 12 day DMA | 5342.79 | | 20 day DMA | 5287.85 | | 35 day DMA | 5204.61 | | 50 day DMA | 5250.07 | | 100 day DMA | 5363.7 | | 150 day DMA | 5078.66 | | 200 day DMA | 4912.37 | EMA (exponential moving average) of Pfizer PFIZER
| EMA period | EMA current | EMA prev | EMA prev2 | | 5 day EMA | 5298.56 | 5313.09 | 5324.39 | | 12 day EMA | 5300.46 | 5306.09 | 5308.92 | | 20 day EMA | 5280.28 | 5281.41 | 5280.45 | | 35 day EMA | 5272.15 | 5272.31 | 5271.24 | | 50 day EMA | 5244.21 | 5243.18 | 5241.25 |
SMA (simple moving average) of Pfizer PFIZER
| SMA period | SMA current | SMA prev | SMA prev2 | | 5 day SMA | 5301.5 | 5317.9 | 5324.7 | | 12 day SMA | 5342.79 | 5348.08 | 5346.08 | | 20 day SMA | 5287.85 | 5269.65 | 5251.68 | | 35 day SMA | 5204.61 | 5201.01 | 5196.09 | | 50 day SMA | 5250.07 | 5251.24 | 5247.57 | | 100 day SMA | 5363.7 | 5368.98 | 5373.58 | | 150 day SMA | 5078.66 | 5070.97 | 5062.82 | | 200 day SMA | 4912.37 | 4912.76 | 4911.95 |
|
|
