PentagonRubber PENTAGON_SM full analysis,charts,indicators,moving averages,SMA,DMA,EMA,ADX,MACD,RSIPentagon Rubber PENTAGON_SM WideScreen charts, DMA,SMA,EMA technical analysis, forecast prediction, by indicators ADX,MACD,RSI,CCI NSE stock exchange
Daily price and charts and targets PentagonRubber Strong Daily Stock price targets for PentagonRubber PENTAGON_SM are 91.45 and 93.3 | Daily Target 1 | 90.93 | | Daily Target 2 | 91.97 | | Daily Target 3 | 92.783333333333 | | Daily Target 4 | 93.82 | | Daily Target 5 | 94.63 |
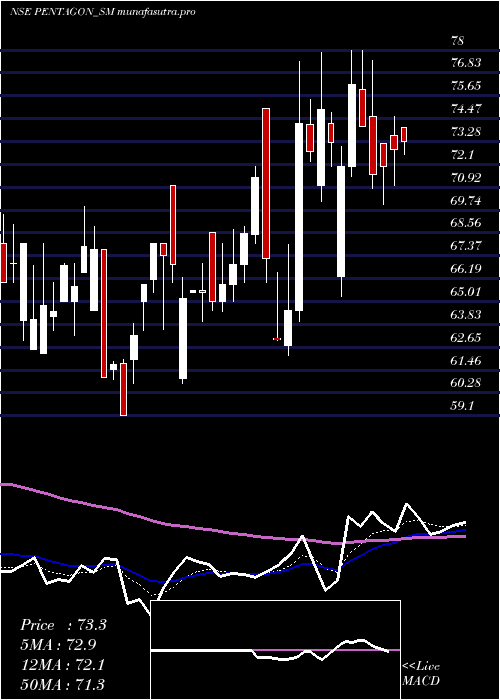
Daily price and volume Pentagon Rubber
| Date |
Closing |
Open |
Range |
Volume |
Wed 29 October 2025 |
93.00 (-0.64%) |
93.60 |
91.75 - 93.60 |
0.1634 times |
Tue 28 October 2025 |
93.60 (3.54%) |
88.90 |
87.05 - 99.50 |
2.7124 times |
Mon 27 October 2025 |
90.40 (4.21%) |
88.45 |
88.45 - 95.00 |
1.9281 times |
Fri 24 October 2025 |
86.75 (11.65%) |
77.70 |
77.70 - 89.00 |
3.4967 times |
Thu 23 October 2025 |
77.70 (6.44%) |
75.40 |
75.00 - 79.00 |
0.6863 times |
Tue 21 October 2025 |
73.00 (2.24%) |
73.00 |
73.00 - 73.00 |
0.1307 times |
Fri 17 October 2025 |
71.40 (-2.19%) |
73.00 |
71.40 - 73.00 |
0.098 times |
Thu 16 October 2025 |
73.00 (1.39%) |
71.70 |
71.70 - 73.00 |
0.1961 times |
Wed 15 October 2025 |
72.00 (1.84%) |
70.00 |
70.00 - 72.00 |
0.2288 times |
Tue 14 October 2025 |
70.70 (-2.08%) |
72.05 |
70.00 - 72.05 |
0.3595 times |
Mon 13 October 2025 |
72.20 (3.96%) |
72.00 |
70.00 - 73.00 |
0.817 times |
Weekly price and charts PentagonRubber Strong weekly Stock price targets for PentagonRubber PENTAGON_SM are 90.03 and 102.48 | Weekly Target 1 | 80.73 | | Weekly Target 2 | 86.87 | | Weekly Target 3 | 93.183333333333 | | Weekly Target 4 | 99.32 | | Weekly Target 5 | 105.63 |
Weekly price and volumes for Pentagon Rubber
| Date |
Closing |
Open |
Range |
Volume |
Wed 29 October 2025 |
93.00 (7.2%) |
88.45 |
87.05 - 99.50 |
1.1741 times |
Fri 24 October 2025 |
86.75 (21.5%) |
73.00 |
73.00 - 89.00 |
1.0543 times |
Fri 17 October 2025 |
71.40 (2.81%) |
72.00 |
70.00 - 73.00 |
0.4153 times |
Fri 10 October 2025 |
69.45 (-3.47%) |
69.05 |
68.00 - 75.05 |
0.3435 times |
Fri 03 October 2025 |
71.95 (-0.07%) |
74.45 |
67.05 - 78.00 |
1.2859 times |
Fri 26 September 2025 |
72.00 (27.21%) |
62.95 |
62.95 - 80.90 |
4.7764 times |
Fri 19 September 2025 |
56.60 (5.01%) |
53.90 |
51.40 - 58.00 |
0.2476 times |
Fri 12 September 2025 |
53.90 (5.38%) |
50.55 |
50.55 - 55.90 |
0.2077 times |
Fri 05 September 2025 |
51.15 (-1.73%) |
52.05 |
50.60 - 52.75 |
0.2476 times |
Fri 29 August 2025 |
52.05 (-4.76%) |
54.60 |
51.15 - 54.65 |
0.2476 times |
Fri 22 August 2025 |
54.65 (-4.96%) |
57.00 |
53.00 - 57.50 |
0.5351 times |

Monthly price and charts PentagonRubber Strong monthly Stock price targets for PentagonRubber PENTAGON_SM are 80.03 and 112.48 | Monthly Target 1 | 54.07 | | Monthly Target 2 | 73.53 | | Monthly Target 3 | 86.516666666667 | | Monthly Target 4 | 105.98 | | Monthly Target 5 | 118.97 |
Monthly price and volumes Pentagon Rubber
| Date |
Closing |
Open |
Range |
Volume |
Wed 29 October 2025 |
93.00 (21.57%) |
76.50 |
67.05 - 99.50 |
1.0778 times |
Tue 30 September 2025 |
76.50 (46.97%) |
52.05 |
50.55 - 80.90 |
1.9475 times |
Fri 29 August 2025 |
52.05 (-15.78%) |
62.20 |
51.15 - 62.20 |
0.5872 times |
Thu 31 July 2025 |
61.80 (-1.12%) |
61.65 |
55.00 - 66.95 |
0.8152 times |
Mon 30 June 2025 |
62.50 (-8.76%) |
67.05 |
56.00 - 73.20 |
1.4172 times |
Fri 30 May 2025 |
68.50 (-4.6%) |
73.50 |
67.85 - 76.00 |
0.7309 times |
Wed 30 April 2025 |
71.80 (11.23%) |
64.55 |
64.00 - 85.50 |
0.9836 times |
Fri 28 March 2025 |
64.55 (5.65%) |
61.50 |
59.10 - 75.00 |
0.9167 times |
Fri 28 February 2025 |
61.10 (-11.9%) |
69.95 |
61.10 - 70.00 |
0.5872 times |
Fri 31 January 2025 |
69.35 (-21.64%) |
90.95 |
68.00 - 97.95 |
0.9366 times |
Tue 31 December 2024 |
88.50 (4.12%) |
81.00 |
81.00 - 103.80 |
0.939 times |

DMA SMA EMA moving averages of Pentagon Rubber PENTAGON_SM
DMA (daily moving average) of Pentagon Rubber PENTAGON_SM
| DMA period | DMA value | | 5 day DMA | 88.29 | | 12 day DMA | 78.6 | | 20 day DMA | 76.38 | | 35 day DMA | 69.11 | | 50 day DMA | 64.61 | | 100 day DMA | 63.48 | | 150 day DMA | 65.96 | | 200 day DMA | 67.56 | EMA (exponential moving average) of Pentagon Rubber PENTAGON_SM
| EMA period | EMA current | EMA prev | EMA prev2 | | 5 day EMA | 88.39 | 86.09 | 82.33 | | 12 day EMA | 81.69 | 79.64 | 77.1 | | 20 day EMA | 77.35 | 75.7 | 73.82 | | 35 day EMA | 71.51 | 70.24 | 68.86 | | 50 day EMA | 66.49 | 65.41 | 64.26 |
SMA (simple moving average) of Pentagon Rubber PENTAGON_SM
| SMA period | SMA current | SMA prev | SMA prev2 | | 5 day SMA | 88.29 | 84.29 | 79.85 | | 12 day SMA | 78.6 | 76.9 | 75.15 | | 20 day SMA | 76.38 | 75.33 | 74.25 | | 35 day SMA | 69.11 | 67.93 | 66.73 | | 50 day SMA | 64.61 | 63.9 | 63.19 | | 100 day SMA | 63.48 | 63.22 | 62.97 | | 150 day SMA | 65.96 | 65.78 | 65.59 | | 200 day SMA | 67.56 | 67.55 | 67.52 |
|
|
