Pds PDSL full analysis,charts,indicators,moving averages,SMA,DMA,EMA,ADX,MACD,RSIPds PDSL WideScreen charts, DMA,SMA,EMA technical analysis, forecast prediction, by indicators ADX,MACD,RSI,CCI NSE stock exchange
Daily price and charts and targets Pds Strong Daily Stock price targets for Pds PDSL are 333.63 and 363.68 | Daily Target 1 | 309.2 | | Daily Target 2 | 328 | | Daily Target 3 | 339.25 | | Daily Target 4 | 358.05 | | Daily Target 5 | 369.3 |
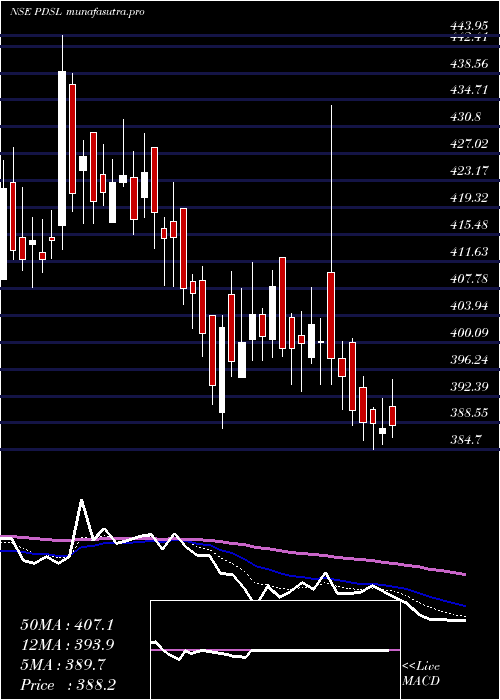
Daily price and volume Pds
| Date |
Closing |
Open |
Range |
Volume |
Wed 29 October 2025 |
346.80 (5.15%) |
332.45 |
320.45 - 350.50 |
1.4906 times |
Tue 28 October 2025 |
329.80 (0.06%) |
328.00 |
324.85 - 343.85 |
0.8993 times |
Mon 27 October 2025 |
329.60 (-1.95%) |
337.50 |
327.05 - 339.10 |
0.6135 times |
Fri 24 October 2025 |
336.15 (-0.1%) |
336.50 |
334.25 - 340.55 |
0.2709 times |
Thu 23 October 2025 |
336.50 (0.88%) |
338.00 |
335.00 - 343.20 |
0.6932 times |
Tue 21 October 2025 |
333.55 (5.25%) |
323.30 |
323.30 - 335.80 |
0.7131 times |
Mon 20 October 2025 |
316.90 (2%) |
311.90 |
308.00 - 323.20 |
1.5411 times |
Fri 17 October 2025 |
310.70 (-0.1%) |
308.35 |
297.05 - 318.00 |
1.7577 times |
Thu 16 October 2025 |
311.00 (5.14%) |
295.80 |
294.25 - 316.80 |
1.4743 times |
Wed 15 October 2025 |
295.80 (0.72%) |
295.00 |
292.85 - 298.20 |
0.5462 times |
Tue 14 October 2025 |
293.70 (-2%) |
301.15 |
289.95 - 302.45 |
0.5867 times |
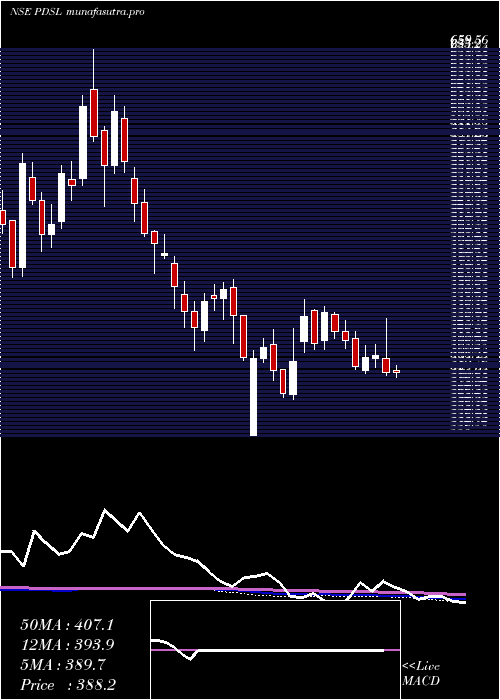
Weekly price and charts Pds Strong weekly Stock price targets for Pds PDSL are 333.63 and 363.68 | Weekly Target 1 | 309.2 | | Weekly Target 2 | 328 | | Weekly Target 3 | 339.25 | | Weekly Target 4 | 358.05 | | Weekly Target 5 | 369.3 |
Weekly price and volumes for Pds
| Date |
Closing |
Open |
Range |
Volume |
Wed 29 October 2025 |
346.80 (3.17%) |
337.50 |
320.45 - 350.50 |
1.2001 times |
Fri 24 October 2025 |
336.15 (8.19%) |
311.90 |
308.00 - 343.20 |
1.2859 times |
Fri 17 October 2025 |
310.70 (0.1%) |
310.30 |
289.95 - 318.00 |
2.0611 times |
Fri 10 October 2025 |
310.40 (-2.13%) |
320.70 |
303.75 - 320.90 |
1.2502 times |
Fri 03 October 2025 |
317.15 (-2.16%) |
324.00 |
311.25 - 324.00 |
0.5728 times |
Fri 26 September 2025 |
324.15 (-8.34%) |
350.65 |
321.50 - 353.55 |
0.4036 times |
Fri 19 September 2025 |
353.65 (10.21%) |
324.95 |
320.25 - 357.50 |
0.9784 times |
Fri 12 September 2025 |
320.90 (-0.9%) |
327.50 |
320.00 - 339.00 |
0.5877 times |
Fri 05 September 2025 |
323.80 (0.57%) |
324.00 |
317.80 - 331.20 |
0.9194 times |
Fri 29 August 2025 |
321.95 (-1.47%) |
328.00 |
316.20 - 336.00 |
0.741 times |
Fri 22 August 2025 |
326.75 (3.25%) |
318.45 |
317.55 - 350.20 |
0.9877 times |
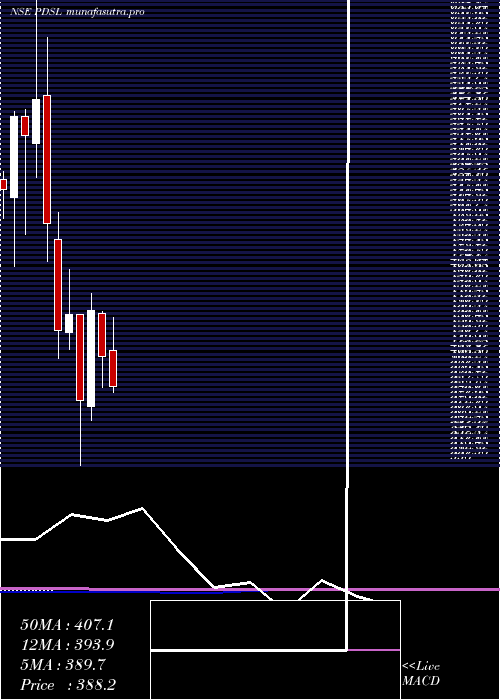
Monthly price and charts Pds Strong monthly Stock price targets for Pds PDSL are 318.38 and 378.93 | Monthly Target 1 | 268.53 | | Monthly Target 2 | 307.67 | | Monthly Target 3 | 329.08333333333 | | Monthly Target 4 | 368.22 | | Monthly Target 5 | 389.63 |
Monthly price and volumes Pds
| Date |
Closing |
Open |
Range |
Volume |
Wed 29 October 2025 |
346.80 (9.01%) |
318.15 |
289.95 - 350.50 |
1.7726 times |
Tue 30 September 2025 |
318.15 (-1.18%) |
324.00 |
311.25 - 357.50 |
0.9287 times |
Fri 29 August 2025 |
321.95 (-8.77%) |
352.20 |
314.25 - 362.00 |
0.9463 times |
Thu 31 July 2025 |
352.90 (-13.53%) |
412.20 |
341.05 - 433.90 |
1.2631 times |
Mon 30 June 2025 |
408.10 (-6.99%) |
436.90 |
387.75 - 438.45 |
1.0204 times |
Fri 30 May 2025 |
438.75 (15.72%) |
375.00 |
365.55 - 449.95 |
1.1968 times |
Wed 30 April 2025 |
379.15 (-13.04%) |
436.00 |
336.00 - 436.30 |
0.7289 times |
Fri 28 March 2025 |
436.00 (2.4%) |
424.00 |
413.10 - 466.00 |
0.7177 times |
Fri 28 February 2025 |
425.80 (-14.29%) |
486.00 |
406.85 - 504.00 |
0.6513 times |
Fri 31 January 2025 |
496.80 (-14.18%) |
581.90 |
471.10 - 619.95 |
0.7743 times |
Tue 31 December 2024 |
578.90 (4.27%) |
550.00 |
527.35 - 659.00 |
2.1304 times |
DMA SMA EMA moving averages of Pds PDSL
DMA (daily moving average) of Pds PDSL
| DMA period | DMA value | | 5 day DMA | 335.77 | | 12 day DMA | 320.02 | | 20 day DMA | 317.1 | | 35 day DMA | 324.12 | | 50 day DMA | 324.55 | | 100 day DMA | 353.17 | | 150 day DMA | 373.07 | | 200 day DMA | 399.6 | EMA (exponential moving average) of Pds PDSL
| EMA period | EMA current | EMA prev | EMA prev2 | | 5 day EMA | 334.91 | 328.97 | 328.55 | | 12 day EMA | 326.67 | 323.01 | 321.77 | | 20 day EMA | 323.82 | 321.4 | 320.52 | | 35 day EMA | 322.74 | 321.32 | 320.82 | | 50 day EMA | 325.4 | 324.53 | 324.31 |
SMA (simple moving average) of Pds PDSL
| SMA period | SMA current | SMA prev | SMA prev2 | | 5 day SMA | 335.77 | 333.12 | 330.54 | | 12 day SMA | 320.02 | 316.98 | 315.42 | | 20 day SMA | 317.1 | 315.42 | 315.14 | | 35 day SMA | 324.12 | 323.55 | 323.38 | | 50 day SMA | 324.55 | 323.94 | 323.74 | | 100 day SMA | 353.17 | 353.92 | 354.82 | | 150 day SMA | 373.07 | 373.78 | 374.56 | | 200 day SMA | 399.6 | 400.84 | 402.1 |
|
|
