PavnaIndustries PAVNAIND full analysis,charts,indicators,moving averages,SMA,DMA,EMA,ADX,MACD,RSIPavna Industries PAVNAIND WideScreen charts, DMA,SMA,EMA technical analysis, forecast prediction, by indicators ADX,MACD,RSI,CCI NSE stock exchange
Daily price and charts and targets PavnaIndustries Strong Daily Stock price targets for PavnaIndustries PAVNAIND are 36 and 39.05 | Daily Target 1 | 35.32 | | Daily Target 2 | 36.68 | | Daily Target 3 | 38.366666666667 | | Daily Target 4 | 39.73 | | Daily Target 5 | 41.42 |
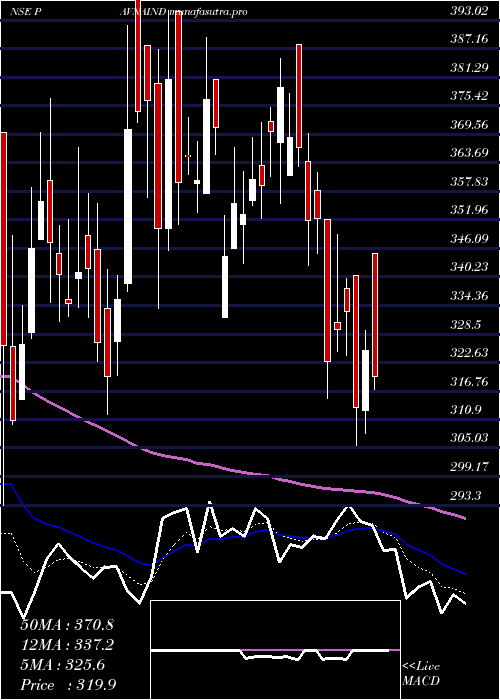
Daily price and volume Pavna Industries
| Date |
Closing |
Open |
Range |
Volume |
Tue 28 October 2025 |
38.05 (-2.93%) |
38.95 |
37.00 - 40.05 |
3.8316 times |
Mon 27 October 2025 |
39.20 (11.02%) |
35.30 |
34.20 - 40.69 |
1.8738 times |
Fri 24 October 2025 |
35.31 (-1.15%) |
36.10 |
34.91 - 36.80 |
2.3795 times |
Thu 23 October 2025 |
35.72 (-2.88%) |
36.05 |
35.49 - 37.39 |
0.4933 times |
Tue 21 October 2025 |
36.78 (1.41%) |
36.99 |
36.00 - 36.99 |
0.0575 times |
Mon 20 October 2025 |
36.27 (-1.04%) |
36.60 |
35.85 - 37.59 |
0.2535 times |
Fri 17 October 2025 |
36.65 (-0.97%) |
36.53 |
36.41 - 38.04 |
0.1362 times |
Thu 16 October 2025 |
37.01 (-0.54%) |
37.90 |
36.55 - 39.30 |
0.3919 times |
Wed 15 October 2025 |
37.21 (-0.51%) |
37.40 |
37.10 - 37.96 |
0.1567 times |
Tue 14 October 2025 |
37.40 (-4.45%) |
40.05 |
36.89 - 40.05 |
0.4259 times |
Mon 13 October 2025 |
39.14 (-2.47%) |
42.30 |
38.70 - 42.30 |
0.6278 times |
Weekly price and charts PavnaIndustries Strong weekly Stock price targets for PavnaIndustries PAVNAIND are 36.13 and 42.62 | Weekly Target 1 | 31.16 | | Weekly Target 2 | 34.6 | | Weekly Target 3 | 37.646666666667 | | Weekly Target 4 | 41.09 | | Weekly Target 5 | 44.14 |
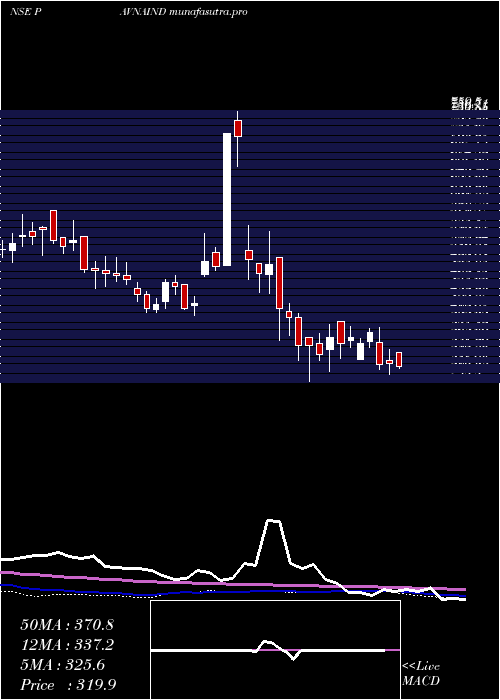
Weekly price and volumes for Pavna Industries
| Date |
Closing |
Open |
Range |
Volume |
Tue 28 October 2025 |
38.05 (7.76%) |
35.30 |
34.20 - 40.69 |
1.5983 times |
Fri 24 October 2025 |
35.31 (-3.66%) |
36.60 |
34.91 - 37.59 |
0.8919 times |
Fri 17 October 2025 |
36.65 (-8.67%) |
42.30 |
36.41 - 42.30 |
0.487 times |
Fri 10 October 2025 |
40.13 (4.83%) |
37.90 |
35.54 - 41.90 |
0.5713 times |
Fri 03 October 2025 |
38.28 (2.77%) |
37.30 |
36.50 - 39.29 |
0.2524 times |
Fri 26 September 2025 |
37.25 (-4.73%) |
39.10 |
36.50 - 42.50 |
1.4814 times |
Fri 19 September 2025 |
39.10 (17.24%) |
33.05 |
32.60 - 43.80 |
3.3884 times |
Fri 12 September 2025 |
33.35 (-3.47%) |
34.55 |
33.00 - 38.50 |
0.5654 times |
Fri 05 September 2025 |
34.55 (-91.64%) |
41.85 |
34.10 - 42.40 |
0.6966 times |
Fri 29 August 2025 |
413.20 (-6.43%) |
448.50 |
408.55 - 450.00 |
0.0673 times |
Fri 22 August 2025 |
441.60 (7.67%) |
423.00 |
415.00 - 459.95 |
0.2016 times |
Monthly price and charts PavnaIndustries Strong monthly Stock price targets for PavnaIndustries PAVNAIND are 36.13 and 44.23 | Monthly Target 1 | 30.08 | | Monthly Target 2 | 34.07 | | Monthly Target 3 | 38.183333333333 | | Monthly Target 4 | 42.17 | | Monthly Target 5 | 46.28 |
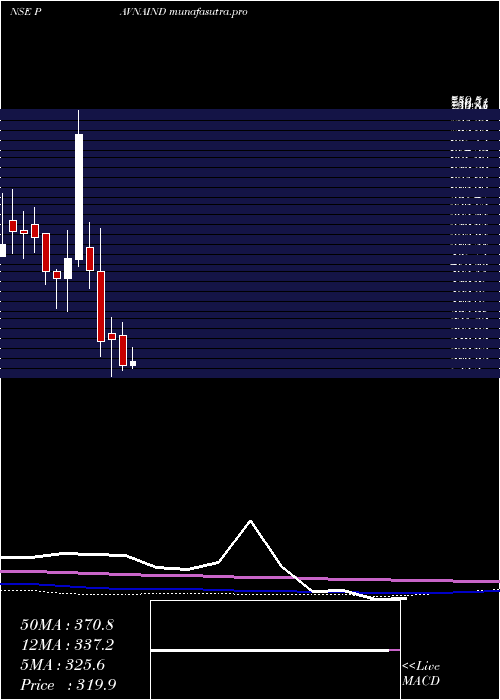
Monthly price and volumes Pavna Industries
| Date |
Closing |
Open |
Range |
Volume |
Tue 28 October 2025 |
38.05 (2.84%) |
37.35 |
34.20 - 42.30 |
3.0393 times |
Tue 30 September 2025 |
37.00 (-91.05%) |
41.85 |
32.60 - 43.80 |
5.189 times |
Fri 29 August 2025 |
413.20 (5.22%) |
383.35 |
350.20 - 459.95 |
0.3145 times |
Thu 31 July 2025 |
392.70 (-9.16%) |
434.50 |
383.95 - 455.00 |
0.2007 times |
Mon 30 June 2025 |
432.30 (9.62%) |
394.00 |
375.35 - 469.60 |
0.224 times |
Fri 30 May 2025 |
394.35 (25.83%) |
312.80 |
303.55 - 425.50 |
0.3036 times |
Wed 30 April 2025 |
313.40 (-12.88%) |
365.15 |
305.55 - 389.40 |
0.1402 times |
Fri 28 March 2025 |
359.75 (1.21%) |
370.00 |
293.30 - 398.00 |
0.3093 times |
Fri 28 February 2025 |
355.45 (-25.96%) |
478.05 |
330.00 - 553.85 |
0.1662 times |
Fri 31 January 2025 |
480.05 (-33.1%) |
520.00 |
447.65 - 564.00 |
0.1132 times |
Wed 16 October 2024 |
717.60 (43.46%) |
498.00 |
486.00 - 759.50 |
2.5746 times |
DMA SMA EMA moving averages of Pavna Industries PAVNAIND
DMA (daily moving average) of Pavna Industries PAVNAIND
| DMA period | DMA value | | 5 day DMA | 37.01 | | 12 day DMA | 37.41 | | 20 day DMA | 37.27 | | 35 day DMA | 37.24 | | 50 day DMA | 115.28 | | 100 day DMA | 263.11 | | 150 day DMA | 298.67 | | 200 day DMA | 337.22 | EMA (exponential moving average) of Pavna Industries PAVNAIND
| EMA period | EMA current | EMA prev | EMA prev2 | | 5 day EMA | 37.43 | 37.12 | 36.08 | | 12 day EMA | 37.7 | 37.64 | 37.36 | | 20 day EMA | 45.75 | 46.56 | 47.33 | | 35 day EMA | 88.48 | 91.45 | 94.53 | | 50 day EMA | 129.48 | 133.21 | 137.05 |
SMA (simple moving average) of Pavna Industries PAVNAIND
| SMA period | SMA current | SMA prev | SMA prev2 | | 5 day SMA | 37.01 | 36.66 | 36.15 | | 12 day SMA | 37.41 | 37.24 | 37 | | 20 day SMA | 37.27 | 37.23 | 37.17 | | 35 day SMA | 37.24 | 37.14 | 37.07 | | 50 day SMA | 115.28 | 122.89 | 129.97 | | 100 day SMA | 263.11 | 266.61 | 270.19 | | 150 day SMA | 298.67 | 300.55 | 302.46 | | 200 day SMA | 337.22 | 339.49 | 341.78 |
|
|
