PattechFitwell PATTECH_ST full analysis,charts,indicators,moving averages,SMA,DMA,EMA,ADX,MACD,RSIPattech Fitwell PATTECH_ST WideScreen charts, DMA,SMA,EMA technical analysis, forecast prediction, by indicators ADX,MACD,RSI,CCI NSE stock exchange
Daily price and charts and targets PattechFitwell Strong Daily Stock price targets for PattechFitwell PATTECH_ST are 131.43 and 131.48 | Daily Target 1 | 131.38 | | Daily Target 2 | 131.42 | | Daily Target 3 | 131.43333333333 | | Daily Target 4 | 131.47 | | Daily Target 5 | 131.48 |
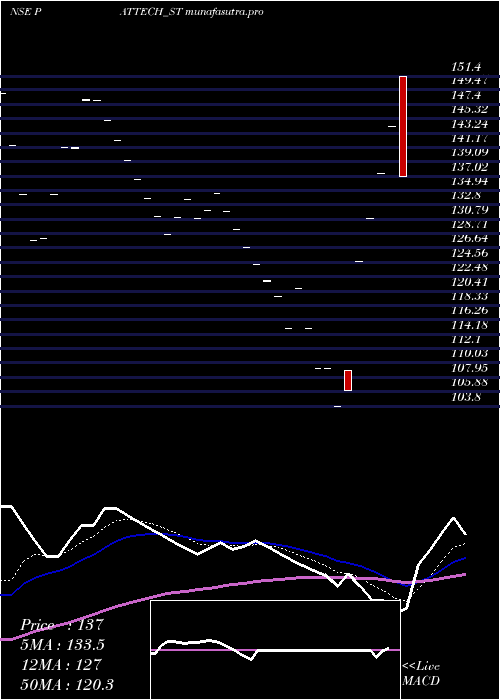
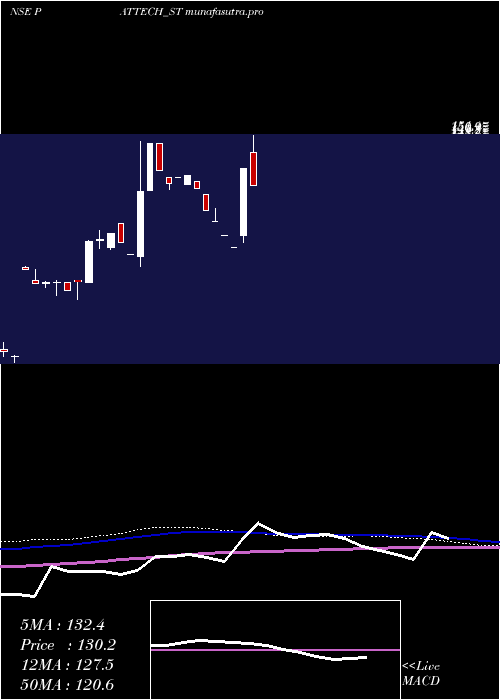
Daily price and volume Pattech Fitwell
| Date |
Closing |
Open |
Range |
Volume |
Mon 27 October 2025 |
131.45 (4.99%) |
131.45 |
131.40 - 131.45 |
3.3333 times |
Fri 24 October 2025 |
125.20 (4.99%) |
125.20 |
125.20 - 125.20 |
0.5556 times |
Thu 23 October 2025 |
119.25 (4.97%) |
119.25 |
119.25 - 119.25 |
0.5556 times |
Tue 21 October 2025 |
113.60 (4.99%) |
113.60 |
113.60 - 113.60 |
0.5556 times |
Mon 20 October 2025 |
108.20 (5%) |
108.20 |
108.20 - 108.20 |
0.5556 times |
Fri 17 October 2025 |
103.05 (1.98%) |
103.05 |
103.05 - 103.05 |
0.5556 times |
Thu 16 October 2025 |
101.05 (-1.89%) |
101.05 |
101.05 - 101.10 |
2.2222 times |
Wed 15 October 2025 |
103.00 (-2%) |
103.00 |
103.00 - 103.00 |
0.5556 times |
Tue 14 October 2025 |
105.10 (-2%) |
105.10 |
105.10 - 105.10 |
0.5556 times |
Mon 13 October 2025 |
107.25 (-1.61%) |
107.25 |
107.25 - 107.25 |
0.5556 times |
Fri 10 October 2025 |
109.00 (-1.98%) |
109.00 |
109.00 - 109.00 |
0.5556 times |
Weekly price and charts PattechFitwell Strong weekly Stock price targets for PattechFitwell PATTECH_ST are 131.43 and 131.48 | Weekly Target 1 | 131.38 | | Weekly Target 2 | 131.42 | | Weekly Target 3 | 131.43333333333 | | Weekly Target 4 | 131.47 | | Weekly Target 5 | 131.48 |
Weekly price and volumes for Pattech Fitwell
| Date |
Closing |
Open |
Range |
Volume |
Mon 27 October 2025 |
131.45 (4.99%) |
131.45 |
131.40 - 131.45 |
0.8219 times |
Fri 24 October 2025 |
125.20 (21.49%) |
108.20 |
108.20 - 125.20 |
0.5479 times |
Fri 17 October 2025 |
103.05 (-5.46%) |
107.25 |
101.05 - 107.25 |
1.0959 times |
Fri 10 October 2025 |
109.00 (-7.71%) |
118.00 |
109.00 - 118.00 |
0.9589 times |
Fri 26 September 2025 |
118.10 (-5.37%) |
122.30 |
118.10 - 122.30 |
0.6849 times |
Thu 18 September 2025 |
124.80 (-7.76%) |
132.60 |
124.80 - 132.60 |
0.6849 times |
Fri 12 September 2025 |
135.30 (8.11%) |
131.40 |
131.40 - 137.95 |
0.6849 times |
Fri 05 September 2025 |
125.15 (4.55%) |
113.75 |
113.75 - 125.35 |
1.5068 times |
Thu 28 August 2025 |
119.70 (-14.22%) |
132.80 |
119.70 - 132.80 |
1.7808 times |
Fri 22 August 2025 |
139.55 (-9.56%) |
151.25 |
139.55 - 151.25 |
1.2329 times |
Thu 14 August 2025 |
154.30 (0.39%) |
156.50 |
154.30 - 157.45 |
1.2329 times |
Monthly price and charts PattechFitwell Strong monthly Stock price targets for PattechFitwell PATTECH_ST are 116.25 and 146.65 | Monthly Target 1 | 90.92 | | Monthly Target 2 | 111.18 | | Monthly Target 3 | 121.31666666667 | | Monthly Target 4 | 141.58 | | Monthly Target 5 | 151.72 |
Monthly price and volumes Pattech Fitwell
| Date |
Closing |
Open |
Range |
Volume |
Mon 27 October 2025 |
131.45 (13.56%) |
113.45 |
101.05 - 131.45 |
0.3369 times |
Tue 30 September 2025 |
115.75 (-3.3%) |
113.75 |
113.75 - 137.95 |
0.4441 times |
Thu 28 August 2025 |
119.70 (-19.39%) |
151.45 |
119.70 - 160.00 |
0.7044 times |
Thu 31 July 2025 |
148.50 (40.09%) |
124.65 |
122.50 - 151.40 |
1.0567 times |
Mon 30 December 2024 |
106.00 (-11.37%) |
115.00 |
103.80 - 120.75 |
0.1225 times |
Thu 28 November 2024 |
119.60 (-7%) |
131.00 |
119.60 - 134.50 |
0.1991 times |
Wed 30 October 2024 |
128.60 (31.36%) |
148.90 |
127.70 - 148.90 |
0.3982 times |
Mon 15 July 2024 |
97.90 (-11%) |
114.00 |
95.95 - 114.00 |
0.3216 times |
Fri 28 June 2024 |
110.00 (28.65%) |
89.75 |
81.95 - 111.00 |
4.196 times |
Fri 31 May 2024 |
85.50 (43.22%) |
57.50 |
55.10 - 96.00 |
2.2205 times |
Fri 28 April 2023 |
59.70 (0%) |
55.00 |
52.55 - 63.60 |
9.9847 times |

DMA SMA EMA moving averages of Pattech Fitwell PATTECH_ST
DMA (daily moving average) of Pattech Fitwell PATTECH_ST
| DMA period | DMA value | | 5 day DMA | 119.54 | | 12 day DMA | 111.45 | | 20 day DMA | 115.48 | | 35 day DMA | 123.15 | | 50 day DMA | 131.67 | | 100 day DMA | 130.1 | | 150 day DMA | | | 200 day DMA | | EMA (exponential moving average) of Pattech Fitwell PATTECH_ST
| EMA period | EMA current | EMA prev | EMA prev2 | | 5 day EMA | 121.4 | 116.38 | 111.97 | | 12 day EMA | 116.65 | 113.96 | 111.92 | | 20 day EMA | 117.77 | 116.33 | 115.4 | | 35 day EMA | 123.16 | 122.67 | 122.52 | | 50 day EMA | 130.42 | 130.38 | 130.59 |
SMA (simple moving average) of Pattech Fitwell PATTECH_ST
| SMA period | SMA current | SMA prev | SMA prev2 | | 5 day SMA | 119.54 | 113.86 | 109.03 | | 12 day SMA | 111.45 | 109.95 | 109.16 | | 20 day SMA | 115.48 | 115.54 | 116.04 | | 35 day SMA | 123.15 | 123.8 | 124.72 | | 50 day SMA | 131.67 | 131.74 | 131.89 | | 100 day SMA | 130.1 | 129.85 | 129.7 | | 150 day SMA | | 200 day SMA |
|
|
