PashupatiCotspin PASHUPATI full analysis,charts,indicators,moving averages,SMA,DMA,EMA,ADX,MACD,RSIPashupati Cotspin PASHUPATI WideScreen charts, DMA,SMA,EMA technical analysis, forecast prediction, by indicators ADX,MACD,RSI,CCI NSE stock exchange
Daily price and charts and targets PashupatiCotspin Strong Daily Stock price targets for PashupatiCotspin PASHUPATI are 803.98 and 806.03 | Daily Target 1 | 802.27 | | Daily Target 2 | 803.63 | | Daily Target 3 | 804.31666666667 | | Daily Target 4 | 805.68 | | Daily Target 5 | 806.37 |
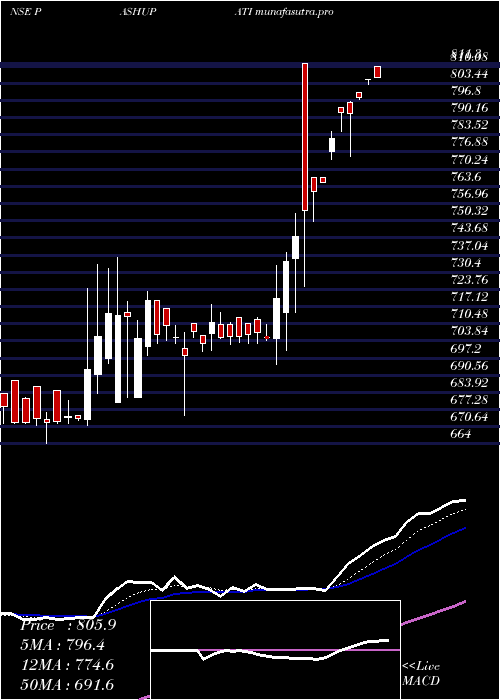
Daily price and volume Pashupati Cotspin
| Date |
Closing |
Open |
Range |
Volume |
Wed 29 October 2025 |
805.00 (0.88%) |
805.00 |
802.95 - 805.00 |
0.6688 times |
Tue 28 October 2025 |
797.95 (0.75%) |
800.00 |
797.35 - 800.00 |
0.2778 times |
Mon 27 October 2025 |
792.00 (-0.02%) |
796.10 |
775.00 - 796.25 |
1.0211 times |
Fri 24 October 2025 |
792.15 (1.31%) |
794.00 |
785.00 - 794.00 |
0.6037 times |
Thu 23 October 2025 |
781.90 (2.21%) |
777.05 |
774.00 - 784.95 |
0.7526 times |
Tue 21 October 2025 |
765.00 (0.45%) |
767.05 |
765.00 - 767.05 |
0.0248 times |
Mon 20 October 2025 |
761.60 (0.98%) |
767.00 |
750.00 - 767.00 |
1.2151 times |
Fri 17 October 2025 |
754.20 (1.33%) |
811.30 |
725.00 - 811.30 |
1.6791 times |
Thu 16 October 2025 |
744.30 (1.33%) |
735.85 |
715.00 - 753.05 |
1.9491 times |
Wed 15 October 2025 |
734.55 (2.01%) |
715.00 |
700.00 - 738.00 |
1.8079 times |
Tue 14 October 2025 |
720.10 (2.14%) |
704.60 |
694.85 - 733.00 |
7.5807 times |
Weekly price and charts PashupatiCotspin Strong weekly Stock price targets for PashupatiCotspin PASHUPATI are 790 and 820 | Weekly Target 1 | 765 | | Weekly Target 2 | 785 | | Weekly Target 3 | 795 | | Weekly Target 4 | 815 | | Weekly Target 5 | 825 |
Weekly price and volumes for Pashupati Cotspin
| Date |
Closing |
Open |
Range |
Volume |
Wed 29 October 2025 |
805.00 (1.62%) |
796.10 |
775.00 - 805.00 |
0.0186 times |
Fri 24 October 2025 |
792.15 (5.03%) |
767.00 |
750.00 - 794.00 |
0.0245 times |
Fri 17 October 2025 |
754.20 (6.68%) |
705.05 |
694.85 - 811.30 |
0.133 times |
Fri 10 October 2025 |
707.00 (-0.58%) |
710.30 |
702.50 - 715.00 |
0.06 times |
Fri 03 October 2025 |
711.15 (0.86%) |
700.80 |
675.00 - 718.00 |
0.0176 times |
Fri 26 September 2025 |
705.10 (-1.16%) |
682.00 |
682.00 - 723.00 |
0.5253 times |
Fri 19 September 2025 |
713.40 (5.88%) |
673.55 |
671.00 - 736.00 |
0.2732 times |
Fri 12 September 2025 |
673.80 (0.22%) |
686.00 |
664.00 - 686.00 |
1.7556 times |
Fri 05 September 2025 |
672.30 (-0.05%) |
685.40 |
669.75 - 688.70 |
3.7034 times |
Fri 29 August 2025 |
672.65 (-2.02%) |
692.55 |
672.00 - 692.60 |
3.4889 times |
Fri 22 August 2025 |
686.50 (-0.51%) |
695.00 |
674.00 - 704.75 |
0.3491 times |

Monthly price and charts PashupatiCotspin Strong monthly Stock price targets for PashupatiCotspin PASHUPATI are 749.93 and 866.38 | Monthly Target 1 | 653.93 | | Monthly Target 2 | 729.47 | | Monthly Target 3 | 770.38333333333 | | Monthly Target 4 | 845.92 | | Monthly Target 5 | 886.83 |
Monthly price and volumes Pashupati Cotspin
| Date |
Closing |
Open |
Range |
Volume |
Wed 29 October 2025 |
805.00 (13.76%) |
706.05 |
694.85 - 811.30 |
0.1074 times |
Tue 30 September 2025 |
707.65 (5.2%) |
685.40 |
664.00 - 736.00 |
2.7448 times |
Fri 29 August 2025 |
672.65 (-2.65%) |
697.00 |
672.00 - 709.80 |
1.8002 times |
Thu 31 July 2025 |
690.95 (963%) |
674.00 |
661.00 - 725.30 |
0.4589 times |
Fri 01 June 2018 |
65.00 (0%) |
65.00 |
65.00 - 65.00 |
0.0103 times |
Mon 28 May 2018 |
65.00 (-7.14%) |
67.20 |
65.00 - 68.10 |
0.2259 times |
Mon 30 April 2018 |
70.00 (4.48%) |
67.00 |
67.00 - 72.80 |
0.5443 times |
Mon 26 March 2018 |
67.00 (-8.97%) |
73.40 |
55.00 - 76.50 |
2.8552 times |
Wed 28 February 2018 |
73.60 (-1.87%) |
72.00 |
70.00 - 73.90 |
0.1438 times |
Wed 31 January 2018 |
75.00 (2.04%) |
74.00 |
72.90 - 76.00 |
1.1092 times |
Fri 29 December 2017 |
73.50 (-1.93%) |
74.95 |
73.40 - 75.00 |
2.2081 times |

DMA SMA EMA moving averages of Pashupati Cotspin PASHUPATI
DMA (daily moving average) of Pashupati Cotspin PASHUPATI
| DMA period | DMA value | | 5 day DMA | 793.8 | | 12 day DMA | 762.81 | | 20 day DMA | 740.26 | | 35 day DMA | 722.32 | | 50 day DMA | 709.22 | | 100 day DMA | 520.57 | | 150 day DMA | 371.77 | | 200 day DMA | | EMA (exponential moving average) of Pashupati Cotspin PASHUPATI
| EMA period | EMA current | EMA prev | EMA prev2 | | 5 day EMA | 791.67 | 785 | 778.52 | | 12 day EMA | 768.86 | 762.29 | 755.81 | | 20 day EMA | 751.75 | 746.15 | 740.7 | | 35 day EMA | 731.88 | 727.57 | 723.43 | | 50 day EMA | 716.4 | 712.78 | 709.3 |
SMA (simple moving average) of Pashupati Cotspin PASHUPATI
| SMA period | SMA current | SMA prev | SMA prev2 | | 5 day SMA | 793.8 | 785.8 | 778.53 | | 12 day SMA | 762.81 | 754.65 | 747.01 | | 20 day SMA | 740.26 | 734.91 | 730.27 | | 35 day SMA | 722.32 | 718.58 | 714.99 | | 50 day SMA | 709.22 | 706.92 | 704.81 | | 100 day SMA | 520.57 | 513.27 | 506.02 | | 150 day SMA | 371.77 | 366.9 | 362.08 | | 200 day SMA |
|
|
