ParasPetrofils PARASPETRO full analysis,charts,indicators,moving averages,SMA,DMA,EMA,ADX,MACD,RSIParas Petrofils PARASPETRO WideScreen charts, DMA,SMA,EMA technical analysis, forecast prediction, by indicators ADX,MACD,RSI,CCI NSE stock exchange
operates under Textiles sector
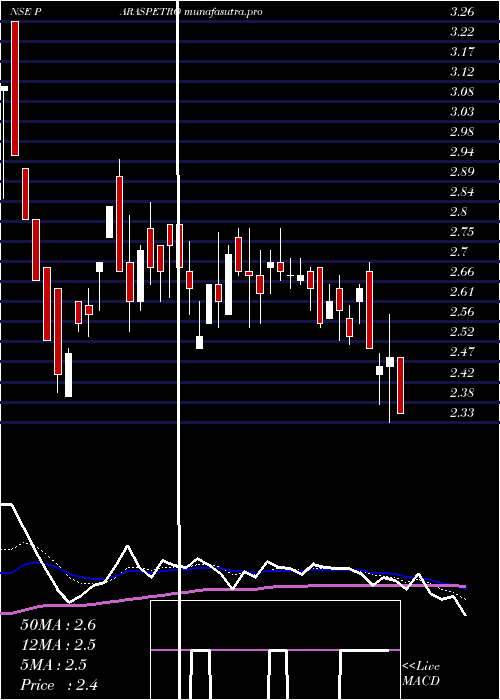
Daily price and charts and targets ParasPetrofils Strong Daily Stock price targets for ParasPetrofils PARASPETRO are 2.07 and 2.2 | Daily Target 1 | 2.05 | | Daily Target 2 | 2.09 | | Daily Target 3 | 2.1766666666667 | | Daily Target 4 | 2.22 | | Daily Target 5 | 2.31 |
Daily price and volume Paras Petrofils
| Date |
Closing |
Open |
Range |
Volume |
Tue 28 October 2025 |
2.14 (-2.73%) |
2.26 |
2.13 - 2.26 |
1.9281 times |
Mon 27 October 2025 |
2.20 (0.46%) |
2.18 |
2.18 - 2.26 |
0.9265 times |
Fri 24 October 2025 |
2.19 (-1.35%) |
2.20 |
2.17 - 2.27 |
0.6838 times |
Thu 23 October 2025 |
2.22 (-0.89%) |
2.29 |
2.16 - 2.29 |
1.3846 times |
Tue 21 October 2025 |
2.24 (1.82%) |
2.26 |
2.21 - 2.26 |
0.3519 times |
Mon 20 October 2025 |
2.20 (-0.9%) |
2.23 |
2.16 - 2.26 |
1.3396 times |
Fri 17 October 2025 |
2.22 (2.78%) |
2.20 |
2.16 - 2.26 |
0.9301 times |
Thu 16 October 2025 |
2.16 (-1.37%) |
2.16 |
2.16 - 2.23 |
0.5881 times |
Wed 15 October 2025 |
2.19 (0.46%) |
2.16 |
2.15 - 2.21 |
1.1415 times |
Tue 14 October 2025 |
2.18 (-2.68%) |
2.25 |
2.18 - 2.25 |
0.7258 times |
Mon 13 October 2025 |
2.24 (0.9%) |
2.26 |
2.21 - 2.28 |
0.656 times |
Weekly price and charts ParasPetrofils Strong weekly Stock price targets for ParasPetrofils PARASPETRO are 2.07 and 2.2 | Weekly Target 1 | 2.05 | | Weekly Target 2 | 2.09 | | Weekly Target 3 | 2.1766666666667 | | Weekly Target 4 | 2.22 | | Weekly Target 5 | 2.31 |
Weekly price and volumes for Paras Petrofils
| Date |
Closing |
Open |
Range |
Volume |
Tue 28 October 2025 |
2.14 (-2.28%) |
2.18 |
2.13 - 2.26 |
0.5079 times |
Fri 24 October 2025 |
2.19 (-1.35%) |
2.23 |
2.16 - 2.29 |
0.6689 times |
Fri 17 October 2025 |
2.22 (0%) |
2.26 |
2.15 - 2.28 |
0.719 times |
Fri 10 October 2025 |
2.22 (0.91%) |
2.20 |
2.20 - 2.35 |
0.9475 times |
Fri 03 October 2025 |
2.20 (-9.84%) |
2.44 |
2.04 - 2.45 |
2.2684 times |
Fri 26 September 2025 |
2.44 (-3.56%) |
2.55 |
2.40 - 2.57 |
0.8294 times |
Fri 19 September 2025 |
2.53 (0%) |
2.56 |
2.50 - 2.62 |
1.0008 times |
Fri 12 September 2025 |
2.53 (4.55%) |
2.43 |
2.31 - 2.75 |
1.9585 times |
Fri 05 September 2025 |
2.42 (0.41%) |
2.54 |
2.36 - 2.54 |
0.5072 times |
Fri 29 August 2025 |
2.41 (-3.6%) |
2.51 |
2.35 - 2.55 |
0.5923 times |
Fri 22 August 2025 |
2.50 (4.6%) |
2.40 |
2.25 - 2.68 |
1.4734 times |
Monthly price and charts ParasPetrofils Strong monthly Stock price targets for ParasPetrofils PARASPETRO are 1.94 and 2.25 | Monthly Target 1 | 1.87 | | Monthly Target 2 | 2 | | Monthly Target 3 | 2.1766666666667 | | Monthly Target 4 | 2.31 | | Monthly Target 5 | 2.49 |
Monthly price and volumes Paras Petrofils
| Date |
Closing |
Open |
Range |
Volume |
Tue 28 October 2025 |
2.14 (-5.73%) |
2.27 |
2.04 - 2.35 |
0.8224 times |
Tue 30 September 2025 |
2.27 (-5.81%) |
2.54 |
2.21 - 2.75 |
0.8771 times |
Fri 29 August 2025 |
2.41 (-0.82%) |
2.50 |
2.19 - 2.70 |
0.7922 times |
Thu 31 July 2025 |
2.43 (-6.54%) |
2.61 |
2.40 - 2.67 |
1.0467 times |
Mon 30 June 2025 |
2.60 (-3.7%) |
2.70 |
2.51 - 2.75 |
1.0859 times |
Fri 30 May 2025 |
2.70 (4.25%) |
2.57 |
2.33 - 2.94 |
0.9666 times |
Wed 30 April 2025 |
2.59 (-3.72%) |
2.74 |
2.50 - 2.80 |
0.7253 times |
Fri 28 March 2025 |
2.69 (26.29%) |
2.13 |
2.11 - 3.26 |
1.311 times |
Fri 28 February 2025 |
2.13 (-26.8%) |
2.90 |
2.11 - 3.02 |
0.9802 times |
Fri 31 January 2025 |
2.91 (-7.32%) |
3.25 |
2.72 - 3.44 |
1.3927 times |
Tue 31 December 2024 |
3.14 (3040%) |
3.13 |
3.00 - 3.23 |
0.1615 times |
DMA SMA EMA moving averages of Paras Petrofils PARASPETRO
DMA (daily moving average) of Paras Petrofils PARASPETRO
| DMA period | DMA value | | 5 day DMA | 2.2 | | 12 day DMA | 2.2 | | 20 day DMA | 2.22 | | 35 day DMA | 2.34 | | 50 day DMA | 2.36 | | 100 day DMA | 2.46 | | 150 day DMA | 2.52 | | 200 day DMA | 2.58 | EMA (exponential moving average) of Paras Petrofils PARASPETRO
| EMA period | EMA current | EMA prev | EMA prev2 | | 5 day EMA | 2.18 | 2.2 | 2.2 | | 12 day EMA | 2.21 | 2.22 | 2.22 | | 20 day EMA | 2.24 | 2.25 | 2.26 | | 35 day EMA | 2.27 | 2.28 | 2.29 | | 50 day EMA | 2.34 | 2.35 | 2.36 |
SMA (simple moving average) of Paras Petrofils PARASPETRO
| SMA period | SMA current | SMA prev | SMA prev2 | | 5 day SMA | 2.2 | 2.21 | 2.21 | | 12 day SMA | 2.2 | 2.21 | 2.21 | | 20 day SMA | 2.22 | 2.24 | 2.25 | | 35 day SMA | 2.34 | 2.34 | 2.35 | | 50 day SMA | 2.36 | 2.37 | 2.38 | | 100 day SMA | 2.46 | 2.46 | 2.47 | | 150 day SMA | 2.52 | 2.53 | 2.53 | | 200 day SMA | 2.58 | 2.59 | 2.59 |
|
|
