ParagonFine PARAGON_SM full analysis,charts,indicators,moving averages,SMA,DMA,EMA,ADX,MACD,RSIParagon Fine PARAGON_SM WideScreen charts, DMA,SMA,EMA technical analysis, forecast prediction, by indicators ADX,MACD,RSI,CCI NSE stock exchange
Daily price and charts and targets ParagonFine Strong Daily Stock price targets for ParagonFine PARAGON_SM are 52.48 and 55.38 | Daily Target 1 | 51.77 | | Daily Target 2 | 53.18 | | Daily Target 3 | 54.666666666667 | | Daily Target 4 | 56.08 | | Daily Target 5 | 57.57 |
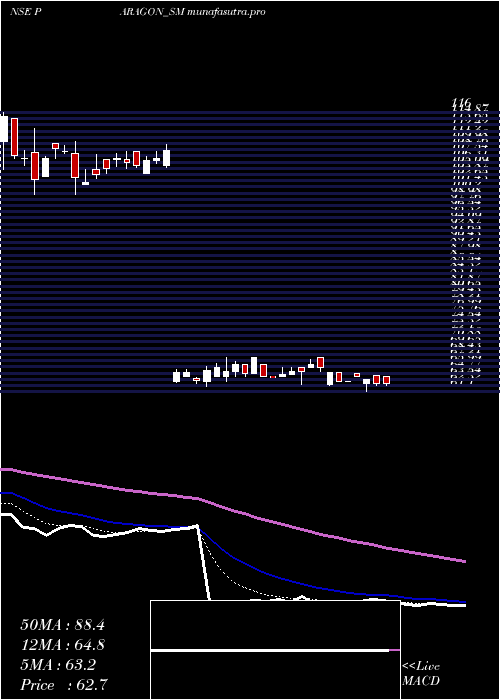
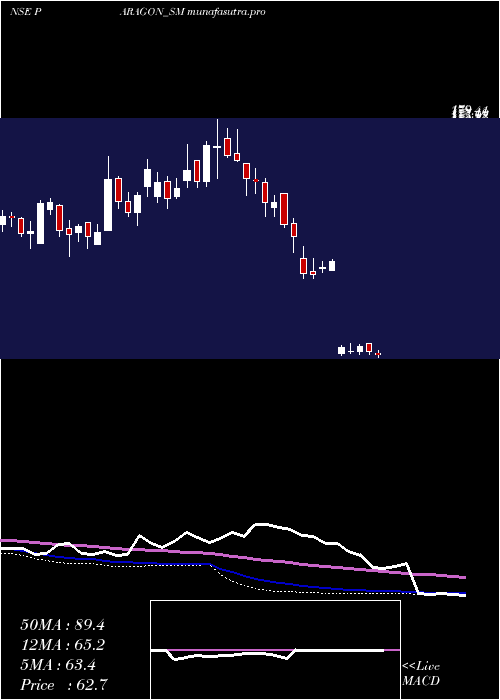
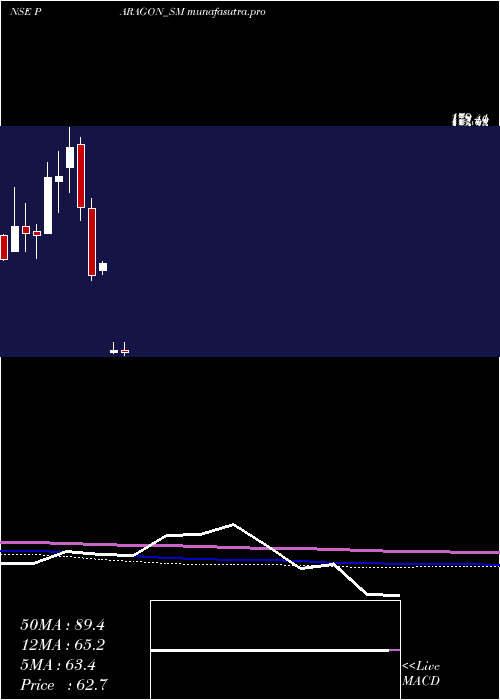
Daily price and volume Paragon Fine
| Date |
Closing |
Open |
Range |
Volume |
Tue 28 October 2025 |
54.60 (-2.33%) |
56.15 |
53.25 - 56.15 |
0.9774 times |
Mon 27 October 2025 |
55.90 (4.58%) |
56.75 |
55.50 - 56.75 |
0.6767 times |
Fri 24 October 2025 |
53.45 (-1.93%) |
54.50 |
53.00 - 54.50 |
1.2782 times |
Tue 21 October 2025 |
54.50 (0.37%) |
54.50 |
54.50 - 54.50 |
0.2256 times |
Mon 20 October 2025 |
54.30 (-0.28%) |
54.00 |
54.00 - 56.40 |
0.4511 times |
Fri 17 October 2025 |
54.45 (0.37%) |
54.20 |
54.20 - 55.40 |
0.8271 times |
Thu 16 October 2025 |
54.25 (-0.09%) |
54.20 |
52.10 - 55.00 |
1.8797 times |
Wed 15 October 2025 |
54.30 (-1.54%) |
54.05 |
54.05 - 56.30 |
0.6015 times |
Tue 14 October 2025 |
55.15 (-4.83%) |
57.95 |
54.15 - 57.95 |
1.8045 times |
Mon 13 October 2025 |
57.95 (2.93%) |
56.05 |
56.05 - 59.00 |
1.2782 times |
Fri 10 October 2025 |
56.30 (-0.44%) |
58.95 |
55.50 - 58.95 |
1.3534 times |
Weekly price and charts ParagonFine Strong weekly Stock price targets for ParagonFine PARAGON_SM are 52.18 and 55.68 | Weekly Target 1 | 51.37 | | Weekly Target 2 | 52.98 | | Weekly Target 3 | 54.866666666667 | | Weekly Target 4 | 56.48 | | Weekly Target 5 | 58.37 |
Weekly price and volumes for Paragon Fine
| Date |
Closing |
Open |
Range |
Volume |
Tue 28 October 2025 |
54.60 (2.15%) |
56.75 |
53.25 - 56.75 |
0.3748 times |
Fri 24 October 2025 |
53.45 (-1.84%) |
54.00 |
53.00 - 56.40 |
0.4429 times |
Fri 17 October 2025 |
54.45 (-3.29%) |
56.05 |
52.10 - 59.00 |
1.448 times |
Fri 10 October 2025 |
56.30 (-1.4%) |
58.90 |
55.00 - 58.95 |
1.1414 times |
Fri 03 October 2025 |
57.10 (5.74%) |
54.00 |
52.20 - 57.60 |
0.937 times |
Fri 26 September 2025 |
54.00 (-6.09%) |
57.00 |
54.00 - 57.95 |
0.5281 times |
Fri 19 September 2025 |
57.50 (7.48%) |
53.10 |
53.10 - 63.00 |
2.6746 times |
Fri 12 September 2025 |
53.50 (-7.76%) |
59.50 |
52.90 - 59.50 |
1.0051 times |
Fri 05 September 2025 |
58.00 (5.45%) |
54.00 |
54.00 - 59.00 |
0.7155 times |
Fri 29 August 2025 |
55.00 (-0.72%) |
56.00 |
54.65 - 59.00 |
0.7325 times |
Fri 22 August 2025 |
55.40 (4.53%) |
53.15 |
53.15 - 56.10 |
0.3748 times |
Monthly price and charts ParagonFine Strong monthly Stock price targets for ParagonFine PARAGON_SM are 53.35 and 60.25 | Monthly Target 1 | 48.33 | | Monthly Target 2 | 51.47 | | Monthly Target 3 | 55.233333333333 | | Monthly Target 4 | 58.37 | | Monthly Target 5 | 62.13 |
Monthly price and volumes Paragon Fine
| Date |
Closing |
Open |
Range |
Volume |
Tue 28 October 2025 |
54.60 (3.02%) |
52.20 |
52.10 - 59.00 |
0.515 times |
Tue 30 September 2025 |
53.00 (-3.64%) |
54.00 |
52.90 - 63.00 |
0.6772 times |
Fri 29 August 2025 |
55.00 (-1.87%) |
56.00 |
52.00 - 59.00 |
0.3309 times |
Thu 31 July 2025 |
56.05 (-12.28%) |
64.00 |
52.55 - 67.75 |
0.9993 times |
Mon 30 June 2025 |
63.90 (-41.16%) |
63.00 |
62.10 - 67.85 |
0.3243 times |
Wed 11 December 2024 |
108.60 (6.11%) |
104.95 |
103.00 - 109.80 |
0.4339 times |
Fri 29 November 2024 |
102.35 (-25.7%) |
137.15 |
100.00 - 142.40 |
1.613 times |
Thu 31 October 2024 |
137.75 (-18.39%) |
169.95 |
131.05 - 173.95 |
0.778 times |
Mon 30 September 2024 |
168.80 (9.86%) |
158.50 |
145.25 - 179.00 |
2.2091 times |
Fri 30 August 2024 |
153.65 (0.2%) |
151.00 |
135.00 - 166.60 |
2.1192 times |
Wed 31 July 2024 |
153.35 (24.67%) |
124.00 |
124.00 - 160.75 |
2.8402 times |
DMA SMA EMA moving averages of Paragon Fine PARAGON_SM
DMA (daily moving average) of Paragon Fine PARAGON_SM
| DMA period | DMA value | | 5 day DMA | 54.55 | | 12 day DMA | 55.14 | | 20 day DMA | 55.14 | | 35 day DMA | 56.06 | | 50 day DMA | 55.75 | | 100 day DMA | 62.93 | | 150 day DMA | 89.43 | | 200 day DMA | 103.56 | EMA (exponential moving average) of Paragon Fine PARAGON_SM
| EMA period | EMA current | EMA prev | EMA prev2 | | 5 day EMA | 54.73 | 54.8 | 54.25 | | 12 day EMA | 55 | 55.07 | 54.92 | | 20 day EMA | 55.29 | 55.36 | 55.3 | | 35 day EMA | 55.38 | 55.43 | 55.4 | | 50 day EMA | 55.59 | 55.63 | 55.62 |
SMA (simple moving average) of Paragon Fine PARAGON_SM
| SMA period | SMA current | SMA prev | SMA prev2 | | 5 day SMA | 54.55 | 54.52 | 54.19 | | 12 day SMA | 55.14 | 55.39 | 55.37 | | 20 day SMA | 55.14 | 55.31 | 55.29 | | 35 day SMA | 56.06 | 56.06 | 56.05 | | 50 day SMA | 55.75 | 55.72 | 55.68 | | 100 day SMA | 62.93 | 63.47 | 64 | | 150 day SMA | 89.43 | 90.17 | 90.83 | | 200 day SMA | 103.56 | 104.07 | 104.48 |
|
|
