PalashSecurities PALASHSECU full analysis,charts,indicators,moving averages,SMA,DMA,EMA,ADX,MACD,RSIPalash Securities PALASHSECU WideScreen charts, DMA,SMA,EMA technical analysis, forecast prediction, by indicators ADX,MACD,RSI,CCI NSE stock exchange
Daily price and charts and targets PalashSecurities Strong Daily Stock price targets for PalashSecurities PALASHSECU are 116.94 and 121.94 | Daily Target 1 | 115.96 | | Daily Target 2 | 117.92 | | Daily Target 3 | 120.96 | | Daily Target 4 | 122.92 | | Daily Target 5 | 125.96 |
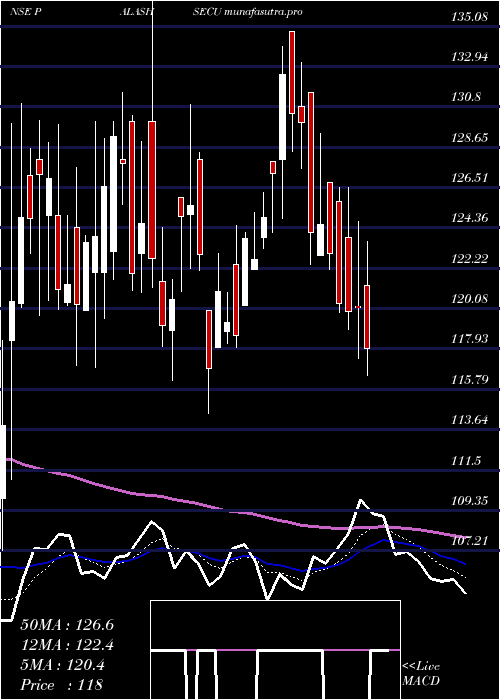
Daily price and volume Palash Securities
| Date |
Closing |
Open |
Range |
Volume |
Tue 28 October 2025 |
119.88 (-1.06%) |
123.99 |
119.00 - 124.00 |
2.1574 times |
Mon 27 October 2025 |
121.17 (-1.41%) |
119.51 |
119.51 - 126.00 |
1.4435 times |
Fri 24 October 2025 |
122.90 (2.46%) |
119.95 |
119.51 - 123.44 |
0.2075 times |
Thu 23 October 2025 |
119.95 (-0.8%) |
121.00 |
118.61 - 123.39 |
1.3331 times |
Tue 21 October 2025 |
120.92 (0.79%) |
119.38 |
119.38 - 122.40 |
0.0452 times |
Mon 20 October 2025 |
119.97 (-0.35%) |
122.99 |
119.70 - 122.99 |
0.4421 times |
Fri 17 October 2025 |
120.39 (3.17%) |
118.51 |
118.50 - 128.90 |
3.8192 times |
Thu 16 October 2025 |
116.69 (-1.54%) |
119.69 |
116.51 - 122.69 |
0.142 times |
Wed 15 October 2025 |
118.51 (3.06%) |
119.70 |
115.72 - 119.70 |
0.1432 times |
Tue 14 October 2025 |
114.99 (-2.11%) |
120.94 |
113.60 - 120.94 |
0.2668 times |
Mon 13 October 2025 |
117.47 (-0.91%) |
120.30 |
117.35 - 120.30 |
0.1108 times |
Weekly price and charts PalashSecurities Strong weekly Stock price targets for PalashSecurities PALASHSECU are 119.44 and 126.44 | Weekly Target 1 | 114.63 | | Weekly Target 2 | 117.25 | | Weekly Target 3 | 121.62666666667 | | Weekly Target 4 | 124.25 | | Weekly Target 5 | 128.63 |
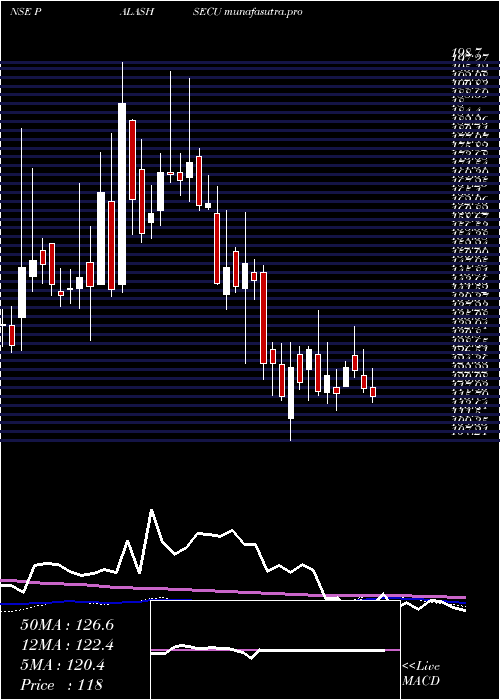
Weekly price and volumes for Palash Securities
| Date |
Closing |
Open |
Range |
Volume |
Tue 28 October 2025 |
119.88 (-2.46%) |
119.51 |
119.00 - 126.00 |
0.75 times |
Fri 24 October 2025 |
122.90 (2.08%) |
122.99 |
118.61 - 123.44 |
0.4224 times |
Fri 17 October 2025 |
120.39 (1.55%) |
120.30 |
113.60 - 128.90 |
0.9335 times |
Fri 10 October 2025 |
118.55 (-1.18%) |
120.00 |
115.52 - 123.70 |
0.663 times |
Fri 03 October 2025 |
119.96 (4.1%) |
116.53 |
115.51 - 132.70 |
4.628 times |
Fri 26 September 2025 |
115.23 (-4.96%) |
123.01 |
114.22 - 123.01 |
0.3516 times |
Fri 19 September 2025 |
121.25 (0.65%) |
125.00 |
119.66 - 129.69 |
0.2137 times |
Fri 12 September 2025 |
120.47 (0.12%) |
121.89 |
119.50 - 134.80 |
1.6583 times |
Fri 05 September 2025 |
120.32 (3.24%) |
116.55 |
116.00 - 124.90 |
0.2934 times |
Fri 29 August 2025 |
116.54 (-1.28%) |
120.49 |
115.00 - 121.09 |
0.0861 times |
Fri 22 August 2025 |
118.05 (-1.04%) |
119.90 |
118.00 - 126.90 |
0.3479 times |
Monthly price and charts PalashSecurities Strong monthly Stock price targets for PalashSecurities PALASHSECU are 107.62 and 125.86 | Monthly Target 1 | 103.53 | | Monthly Target 2 | 111.71 | | Monthly Target 3 | 121.77333333333 | | Monthly Target 4 | 129.95 | | Monthly Target 5 | 140.01 |
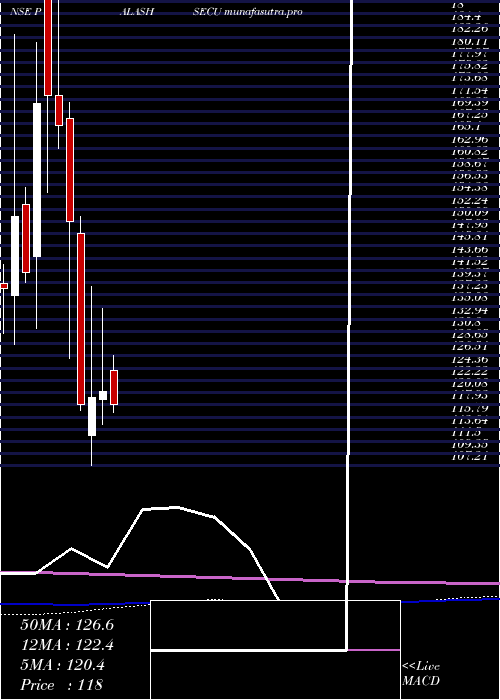
Monthly price and volumes Palash Securities
| Date |
Closing |
Open |
Range |
Volume |
Tue 28 October 2025 |
119.88 (1.74%) |
119.89 |
113.60 - 131.84 |
1.2468 times |
Tue 30 September 2025 |
117.83 (1.11%) |
116.55 |
114.22 - 134.80 |
1.3818 times |
Fri 29 August 2025 |
116.54 (-4.29%) |
120.10 |
115.00 - 126.90 |
0.2761 times |
Thu 31 July 2025 |
121.76 (-4.14%) |
127.16 |
120.00 - 132.99 |
0.3228 times |
Mon 30 June 2025 |
127.02 (2.99%) |
121.23 |
121.23 - 142.00 |
1.3671 times |
Fri 30 May 2025 |
123.33 (2.49%) |
123.87 |
114.60 - 132.20 |
0.9798 times |
Wed 30 April 2025 |
120.33 (0.98%) |
118.93 |
114.50 - 134.80 |
0.5652 times |
Fri 28 March 2025 |
119.16 (0.97%) |
112.55 |
107.21 - 138.70 |
1.3308 times |
Fri 28 February 2025 |
118.02 (-21.37%) |
147.98 |
117.00 - 151.00 |
0.4603 times |
Fri 31 January 2025 |
150.09 (-10.1%) |
168.09 |
126.00 - 171.00 |
2.0692 times |
Tue 31 December 2024 |
166.95 (-3.04%) |
172.18 |
162.85 - 196.45 |
4.4298 times |
DMA SMA EMA moving averages of Palash Securities PALASHSECU
DMA (daily moving average) of Palash Securities PALASHSECU
| DMA period | DMA value | | 5 day DMA | 120.96 | | 12 day DMA | 119.28 | | 20 day DMA | 118.91 | | 35 day DMA | 119.65 | | 50 day DMA | 119.56 | | 100 day DMA | 122.34 | | 150 day DMA | 122.62 | | 200 day DMA | 125.57 | EMA (exponential moving average) of Palash Securities PALASHSECU
| EMA period | EMA current | EMA prev | EMA prev2 | | 5 day EMA | 120.55 | 120.88 | 120.74 | | 12 day EMA | 119.83 | 119.82 | 119.57 | | 20 day EMA | 119.51 | 119.47 | 119.29 | | 35 day EMA | 119.39 | 119.36 | 119.25 | | 50 day EMA | 119.63 | 119.62 | 119.56 |
SMA (simple moving average) of Palash Securities PALASHSECU
| SMA period | SMA current | SMA prev | SMA prev2 | | 5 day SMA | 120.96 | 120.98 | 120.83 | | 12 day SMA | 119.28 | 119.01 | 118.67 | | 20 day SMA | 118.91 | 118.68 | 118.43 | | 35 day SMA | 119.65 | 119.66 | 119.63 | | 50 day SMA | 119.56 | 119.53 | 119.48 | | 100 day SMA | 122.34 | 122.37 | 122.38 | | 150 day SMA | 122.62 | 122.65 | 122.67 | | 200 day SMA | 125.57 | 125.74 | 125.96 |
|
|
